>Corresponding Author : Bahram Masoudi
>Article Type : Research Article
>Volume : 1 | Issue : 1
>Received Date : 19 October, 2021
>Accepted Date : 02 November, 2021
>Published Date : 05 November, 2021
>DOI : https://doi.org/10.54289/JARL2100101
>Citation : Masoudi B, Mardi M, Hervan EM, Bihamta MR, Naghavi MR, et al. (2021) QTL Mapping of Wheat Characteristic Identified A Marker Related to Leaf Senescing Under Salinity Stress. J Agric Res Livest 1(1). doi https://doi.org/10.54289/JARL2100101
>Copyright : © 2021 Masoudi B, et al. This is an open-access article distributed under the terms of the Creative Commons Attribution License, which permits unrestricted use, distribution, and reproduction in any medium, provided the original author and source are credited.
Research Article | Open Access
1Seed and Plant Improvement Institute, Agricultural Research, Education and Extension Organization (AREEO), Karaj, Iran
2Department of Genomics, Agricultural Biotechnology Research Institute of Iran (ABRII), Agricultural Research, Education and Extension Organization (AREEO), Karaj, Iran
3Department of Molecular Physiology, Agricultural Biotechnology Research Institute of Iran (ABRII), Agricultural Research, Education and Extension Organization (AREEO), Karaj, Iran
4Department of plant breeding, The University of Tehran, Karaj, Iran
5Horticulture Crops Research Department, Sistan Agricultural and Natural Resources Research and Education Center, Agricultural Research, Education and Extension Organization (AREEO), Zabol, Iran
6Experimental Center of Agriculture and Natural Resources, Agricultural Research, Education and Extension Organization (AREEO), Yazd, Iran
*Corresponding author: Bahram Masoudi, Seed and Plant Improvement Institute, Agricultural Research, Education and Extension Organization (AREEO), Karaj, Iran
Abstract
The physiological and morphological traits of flag leaf play an important role in determining the biomass and seed yield of crop. In order to understand the genetic control of different traits of flag leaf, a recombinant inbred lines (RIL) population derived from a cross between ‘Roshan’ and ‘Falat’ (seri82) was used to identify the quantitative trait locus (QTL) underlying 4 morphological traits under control and saline environments. We used QTL Cartographer and QTL Network to estimate QTLs of phenotypic values and 16 additive QTLs for different traits of flag leaf were detected by using a genetic map of 730 DArT and SSR markers. We also identified one pairs of epistatic effects using the phenotypic value of single environment for one trait (flag leaf width) in 2 chromosomes. The QTL Network is used to detect QTLs and interaction between them and 1 additive QTL for flag leaf length and 1 additive QTL for flag leaf area were identified. None of the additive QTLs had interaction with environment. Studies of the locus linked to the flag leaf length and weight of flag leaf QTLs revealed that wPt-0549 is belonged to the part of sequence that could encode serpin and cytochrome P450 protein. It could be concluded that serpin and cytochrome P450 genes which are consist of wPt-0549 regulate leaf senescing through their regulation under salinity stress.
Keywords: Flag leaf traits; Wheat; Quantitative trait loci; Salt tolerance
Abbreviations: RIL: recombinant inbred lines, QTL: quantitative trait locus, EC: electrical conductivity, FLL and FLW: flag leaf length and width of the flag leaf, FLA: flag leaves area, WFL: weight of flag leaves, ANOVA; Analysis of variance, SPSS: Statistics 15 software, SSRs: simple sequenced repeats, CIM: composite interval mapping, CV: coefficient of variation
Introduction
Improvements in yield factors (such as biological yield, thousand grain weight, kernel per spike, spike weight) and its related traits can make seed yield better [1]. The inheritance of yield is not simple and not only associated to kernel weight, kernel number per spike and spike number per unit area but also influence by additional things, for example the storage and transportation of photosynthetic yields [2]. It is appeared that plant parts under the flag leaf node have a small role in final performance of plant. The photosynthetic potential which impressing the yield and stress reaction of wheat plants was affected by leaf size, shape, posture as well as ear and awn [3, 4]. As a result, it seems logical that plant structures above the flag leaf node define the final performance of the plant [5]. Seed yield affect by the leaves, especially the flag leaf, where the most of photosynthetic activities (almost 50 %) controlled by it [6, 7]. Grain filling in cereals is usually done by three upper leaves, which are the primary source of photosynthesis in plant [8, 9, 10]. Flag leaf in wheat has an important role in the proportion of photosynthetic assimilates compared to other leaves and can produce a large portion of the carbohydrates stored in the seed [10-12]. So flag leaf in wheat is considered the most important component in seed yield [13-14]. The importance of flag leaf is because of the short interval between flag leaf and spike and the other is that flag leaf stays green longer than other leaves [15]. About 30 to 50 percent of dry matter at maturity is related to flag leaf, and it is the most important site for photosynthesis in the seed filling stage [16, 17].
The performance of a plant is a relationship between many of the physiological and biochemical processes occurring in plants, and a number of genes are involved in this trait and the environment can affect them [18, 19]. Since flag leaf plays an important role, its size is probably important [6].
The positive effect of leaf size on 1000-grain weight, number of grains per spike, grain weight per plant or other yield-related traits has been confirmed by several studies in cereals like rice and wheat [2, 20-22]. By improving the flag leaf morphology, photosynthetic efficiency and yield can be expected to improve [23].
Many researchers observed that decrease in leaf area caused a reduction in plant growth and beside that plant development and leaf area decrease by salinity [24]. Salt stress reduce leaf area and plant height [25]. Death of leaves before development can result from a high level of salinity [26]. The photosynthetic efficiency of next transpiring leaves like flag leaf was affected by this event in adult wheat plants [26].
A new vision for crop growth and development can be achieved by understanding the details function of physiological and morphological characters of flag leaf on plants performance. The analysis of complex traits like yield can be performed using the genetic maps and molecular markers for continuous distribution expression of phenotypes. They are also applicable in detecting related loci and measuring the average genes involved in a trait and defining the relations among QTLs and the environment by using quantitative genetics relied upon statistics [27]. One of the factors that affects quantitative traits is the relation between QTLs and the environment [28-31]. A number of loci with an effect in flag leaf traits have been identified in rice, barley and wheat [19, 20, 23, 32-39]. However, more research is needed to identify QTLs for flag leaf morphology, especially in different environments.
In current study for detecting loci affecting morphological traits of flag leaf at flowering stage by using approach of QTL Cartographer and QTLNetwork [40], we studied a recombinant inbred lines (RIL) population derived from a cross between ‘Roshan’ and ‘Falat’ (seri82) in normal and saline environments. The aim and significance of this study in both theory and application was to study the relationships among flag leaf traits, the effect of salinity on flag leaf traits and to use identified QTLs in marker assisted selection for improving plant yield by improving flag leaf traits, for example by increasing the photosynthetic area.
Materials and Methods
Plant materials and field trials
In present study we use 319 inbred lines (F7) derived from a cross between Roshan and Falat cultivar. The Roshan is a salt tolerant cultivar and the Falat (seri82) is a salt sensitive cultivar [41]. These two parents have an apparently significant difference in terms of morphological traits related to flag leaf.
The population with their parents were grown in two environments; Yazd (55̊ 31´N 22̊ 54´E, 1237 m above sea level, as control environment) and Ardakan (53̊ 48´N 32̊ 20´E, 1237 m above sea level, as saline environment), both located in the central part of Iran. The soil EC of Yazd was 4.5 dS m-1 and the water EC was 3.5 dS m-1. Soil samples were collected from five representative locations (upper left, upper right, lower left, lower right and the middle) of the fields in both Yazd and Ardakan for electrical conductivity (EC) measuring [42]. The soil EC of Ardakan was 12 dS m-1 and the water EC was 10 dS m-1. The experiment was performed in an alpha lattice design with two replicates in each environment. The material was sown in two 2 m rows (interplant distance 2 cm, inter-row distance 20 cm). At flowering, flag leaf length and width of the flag leaf (FLL and FLW) were measured using 10 samples from each plot in both environments. The flag leaf length and width were calculated as follows; flag leaf length: measuring the leaves from the beginning of the ligula to the end of the tip of the leaf; and flag leaf width: measuring the leaves from the widest part of the flag leaf. To find out the flag leaves area (FLA), leaf length and width based on centimeter was measured and multiplied by the coefficient 0.74 [43]. We oven-dried the flag leaves at 75 ̊C for 48h and measured the weight of flag leaves (WFL) in both environment. Agronomic and phenological traits like seed yield, biological yield, thousand seed weight, plant height, spike length, seed weight per spike, number of seed per spike and harvest index were also recorded at maturity using 20 random plants in each plot. In order to measure seed yield, each plot was completely harvested.
Data and QTL analysis
Analysis of variance (ANOVA) of each data set was done using SPSS Statistics 15 software (SPSS Inc, Chicago, USA). The average of two replicates for each trait was calculated before QTL analysis. For QTL analysis, the linkage map of the ‘‘Roshan × Falat’’ population was used [44]. This map contained all the wheat chromosomes and includes 730 markers, including 705 DArT and 25 simple sequenced repeats (SSRs). We determined the main effect QTL for each single-environment phenotypic value by composite interval mapping (CIM) analysis using Win QTL Cartographer and QTLNetwork software and also pleiotropic QTLs by multi-traits composite interval mapping (MCIM) method [45] using Win QTL Cartographer. We also determined the effect of a and aa epistatic QTL and their environmental interactions (ae and aae) with QTL Network software version 2.1 [46, 47] with a mixed linear composite interval mapping method and with joint analysis of the multi-environment phenotypic values for FLL, FLW, FLA and WFL. In both software, significant LOD thresholds were determined by 1,000 permutation test and p = 0.05.
After QTL mapping, in order to reveal the relationship between the identified QTL for leaf traits with a strong LOD and the role of the genes, the flag leaf traits locus and characteristics of their related genes were studied using ensemble plant (link) and NCBI [48].
Results
Evaluation of the flag leaf phenotype and correlations among the traits
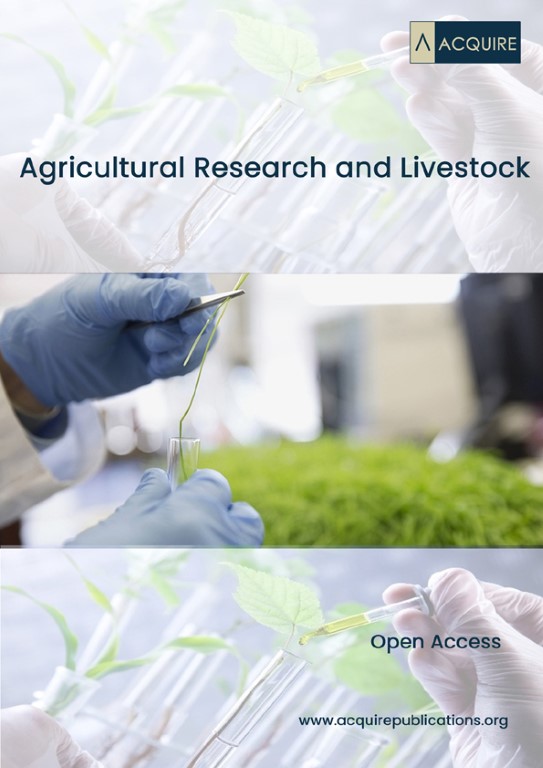
The salt-tolerant Roshan cultivar had higher phenotypic values than sensitive Falat in both environments (Fig 1). There were significant differences in all traits between both parents and inbred lines in both environments (Supplemental Table 1).
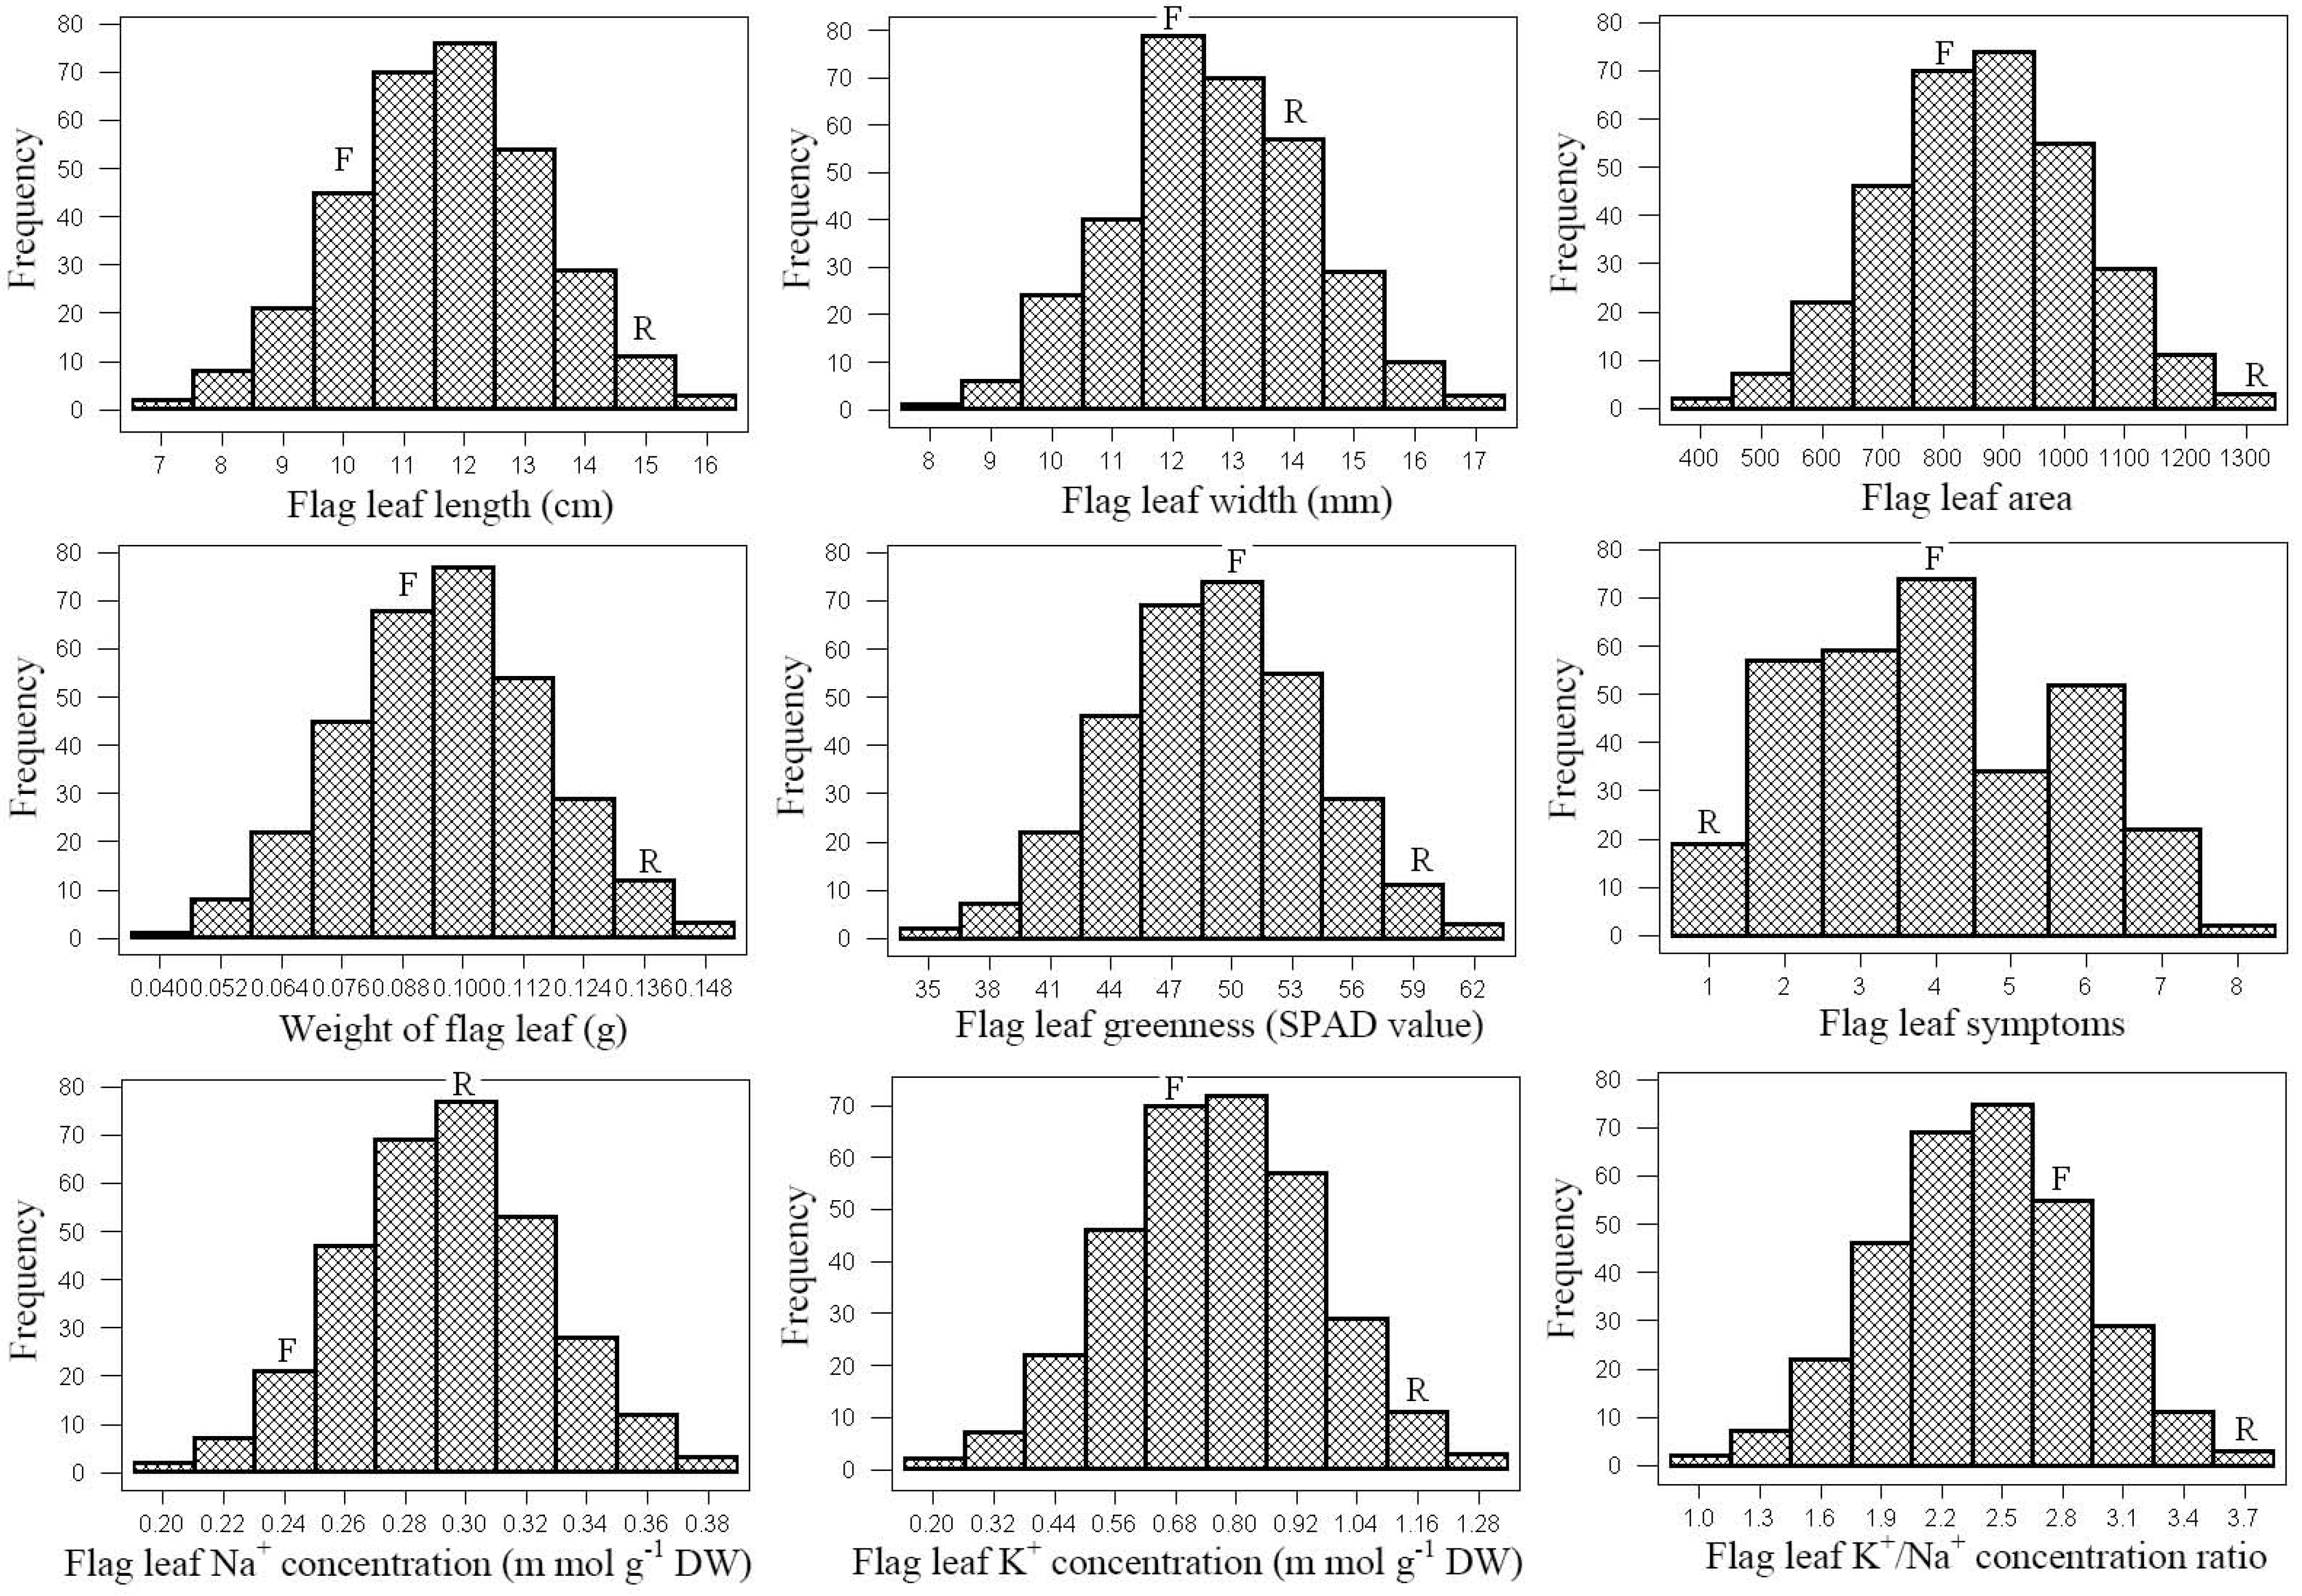
Figure 1: Frequency distribution of the means of traits and parents positions among 319 recombinant inbred lines (RIL) under stress environments. R and F are Roshan and Falat, respectively.
Supplemental Table 1: Phenotypic performance of flag leaf traits in two parents and RIL population under Yazd (control) and Ardakan (saline) environments.
| Trait | environment | parent | RILs | |||||
|---|---|---|---|---|---|---|---|---|
| Roshan | Falat | Mean | Min. | Max. | SD | CV (%) | ||
| Flag leaf length, FLL (cm) | Yazd | 20 ± 1.27 | 16.03 ± 2.53* | 15.19 | 9.43 | 22.2 | 2.29 | 15.09 |
| Ardakan | 15.5 ± 0.26 | 10.8 ± 2* | 10.89 | 6.88 | 16.03 | 1.48 | 13.62 | |
| Flag leaf width, FLW (mm) | Yazd | 14.7 ± 1.2 | 12.8 ± 1* | 12.73 | 8.61 | 17.03 | 1.57 | 12.33 |
| Ardakan | 14.5 ± 1 | 12 ± 1* | 11.91 | 8.17 | 16.17 | 1.38 | 11.6 | |
| Flag leaf area, FLA | Yazd | 1895.66 ± 122.23 | 1283.16 ± 60.55* | 1161.82 | 633.58 | 1996.6 | 239.71 | 20.63 |
| Ardakan | 1457.51 ± 25.41 | 845.97 ± 208.8* | 832.13 | 410.81 | 1300.21 | 159.17 | 19.13 | |
| Weight of flag leaf, WFL | Yazd | 0.185 ± 0.005 | 0.144 ± 0.008* | 0.12 | 0.08 | 0.19 | 0.03 | 23.2 |
| Ardakan | 0.138 ± 0.004 | 0.099 ± 0.007* | 0.08 | 0.04 | 0.14 | 0.02 | 25.7 | |
* The parents were significantly different at the 0.05 probability level
The phenotypic values for the flag leaf traits exhibited wide ranges between the 319 RILs, and the coefficient of variation (CV) of all traits were of 15 % except for FLL and FLW in normal environment (Yazd environment: the N environment) (Supplemental Table 1). FLL and FLA displayed environment effects. The mean values of FLL, FLW and FLA among RILs were higher in N environment than that in the S environment (Ardakan environment: the S environment); however, this difference for FLW was not significant. We observed significant transgressive segregation in both directions and continuous variation for the frequency distribution among all measured traits due to their polygenic inheritance patterns (Fig 1). The significant phenotypic correlations were observed among flag leaf traits and several measured traits in normal and stress environments (Supplemental Table 2). We detected a positive and significant correlation between FLL and FLW in both environments.
The result showed that there were a positive and significant correlation between FLL, FLW and FLA with spike length, number of fertile spikelets per spike and total spikelet per spike in both environments
Also, WFL had a positive and significant correlation with most of the yield components.
A positive correlation was observed between seed yield and leaf area in stress environment. Also, a significant correlation was observed between FLW and seed yield in stress environment.
Supplemental Table 2: Correlation coefficients between flag leaf traits and other traits under Yazd (above) and Ardakan (below) environments.
| SY1 | BY2 | TSW3 | PH4 | SL5 | SW6 | SW\S7 | NS\S8 | AL9 | SS\S10 | TS\S11 | FS\S12 | HI13 | FLA14 | FLW15 | |
|---|---|---|---|---|---|---|---|---|---|---|---|---|---|---|---|
| FLL22 | -0.08 | 0.11* | 0.01 | 0.06 | 0.25** | 0.02 | 0 | -0.01 | 0.28** | 0.14* | 0.26** | 0.19** | -0.14* | 0.83** | 0.19** |
| FLW | -0.06 | 0.02 | 0.01 | 0.03 | 0.13* | 0.18** | 0.17** | 0.15** | -0.11* | 0.15** | 0.31** | 0.24** | -0.08 | 0.70** | |
| FLA | -0.09 | 0.09 | 0.01 | 0.06 | 0.25** | 0.11* | 0.09 | 0.08 | 0.14* | 0.19** | 0.36** | 0.27** | -0.15** | 0.68** | |
| WFL | 0.04 | 0.15* | -0.03 | 0.08 | 0.31** | 0.15** | 0.13* | 0.18** | 0.11* | 0.16** | 0.30** | 0.25** | -0.19** | 0.76** | 0.79** |
| FLL | 0.04 | 0.07 | 0.14* | 0.08 | 0.24** | 0.1 | 0.08 | 0.07 | 0.20** | 0.01 | 0.26** | 0.25** | -0.04 | 0.80** | 0.15** |
| FLW | 0.1 | 0.18** | -0.03 | 0.11* | 0.23** | 0.22** | 0.20** | 0.18** | -0.1 | -0.02 | 0.27** | 0.28** | -0.07 | 0.70** | |
| FLA | 0.11* | 0.16** | 0.08 | 0.13* | 0.31** | 0.21** | 0.18** | 0.17** | 0.09 | -0.01 | 0.35** | 0.35** | -0.07 | 0.70** | |
| WFL | 0.02 | 0.13* | -0.06 | 0.1 | 0.27** | 0.22** | 0.19** | 0.23** | 0.02 | 0.02 | 0.31** | 0.30** | -0.15** | 0.73** | 0.76** |
* Indicates significance at the 0.05 probability level ** Indicates significance at the 0.01 probability level 1 Seed yield; 2 biological yield; 3 thousand seed weight; 4 plant height; 5 spike length; 7 seed weight per spike; 8 number of seed per spike; 9 awn length; 10 sterile spikelet per spike; 11 total spikelet per spike; 12 fertile spikelet per spike; 13 harvest index; 14 flag leaf area; 15 flag leaf width; 16 flag leaf K+/Na+ concentration ratio; 17 flag leaf K+ concentration; 18 flag leaf Na+ concentration; 19 flag leaf greenness; 20 weight of flag leaf; 21 flag leaf symptoms; 22 flag leaf length
Mapping QTLs with additive effects for flag leaf traits
QTL analysis of the 313 RILs detected 16 additive QTL on 9 chromosomes for 4 traits by using Win QTL Cartographer and also 3 additive QTLs on 3 chromosomes for 2 traits using QTLNetwork software (Table 1 and 2; Fig 2).
The distribution of identified QTLs in A, B and D genomes was 4,13 and 2 respectively. The 6 of the QTLs identified by QTL Cartographer software were found in the Yazd environment while the remaining 10 were manifest in the Ardakan environment. The QTLs identified by QTLNetwork software were found only in Ardakan environment. The QTL explained 3.77 to 12.31 % of the phenotypic variation (Table 1 and 2).
Table 1: Location of additive QTLs flag leaf traits in RIL population under Yazd (control) and Ardakan (saline) environments by CIM
| Traits | QTL i | Marker intervala | Siteb | Range (cM) | QTL j | Marker interval | Sitec | Range (cM) | Environments | a or aa | h2(a or aa) | aae1 | aae2 | h2(aae) |
|---|---|---|---|---|---|---|---|---|---|---|---|---|---|---|
| FLA | FLA-7B1 | wPt-743486-wPt-8283 | 10.4 | 5.6-14.7 | * | * | * | * | Ardakan | 46.3705*** | 8.4 | * | * | * |
| WFL | WFL-6B1 | tPt-3689-wPt-8554 | 58.8 | 53.1-68.4 | * | * | * | * | Ardakan | -0.0046*** | 3.9 | * | * | * |
| WFL-7A1 | wPt-742051-wPt-3226 | 171.1 | 164.1-178.4 | * | * | * | * | Ardakan | 0.0081*** | 8.6 | * | * | * | |
| FLW | FLW-3B1 | wPt-5906-wPt-1171 | 126.1 | 120.5-132.1 | FLW-6B1 | wPt-1761-wPt-4924 | 49.1 | 41.1-55.1 | Ardakan | -0.504*** | 8.2 | * | * | * |
| FLL | FLL-4A1 | wPt-5730-tPt-5597 | 15.7 | 9.7-22.7 | * | * | * | * | Both | -0.3263*** | 10.7 | -0.069n.s | 0.071n.s | 0.16 |
| FLA | FLA -7B1 | wPt-743486-wPt-8283 | 10.4 | 5.6-14.7 | * | * | * | * | Both | 47.9176*** | 3.32 | 0n.s | 0n.s | 0.0001 |
b Site means the distance of F value peak for QTL after the first marker in the marker interval
Table 2: QTLs with additive effects (a) (above the highlight parts), epistatic effects (aa) (the highlight parts) and with additive effects (a) and additive × environment interaction effects (ae) (below the highlight parts) under Yazd (e1) and Ardakan (e2) environments detected by QTLNetwork.
| Traits | Chr.a | Marker interval | Range (cM) | Environments | LOD | R2 (%) | Add |
|---|---|---|---|---|---|---|---|
| FLL | 2B-1 | wPt-3561-wPt-8072 | 12.2-17.2 | Yazd | 3.7351 | 4.71 | 0.5193 |
| 7B-1 | wPt-2273-wPt-4814 | 64.7-92.1 | Yazd | 3.2948 | 5.57 | -0.5517 | |
| 3A-1 | wPt-6422-wPt-0549 | 37.2-68.9 | Ardakan | 3.2912 | 12.31 | 0.5337 | |
| 3B-2 | wPt-4412-wPt-7614 | 14.8-20.7 | Ardakan | 4.3665 | 5.06 | -0.3873 | |
| 5D | rPt-3825-wPt-667413 | 82.3-96.4 | Ardakan | 3.9951 | 5.28 | 0.4083 | |
| FLW | 2B-1 | wPt-741382-wPt-0047 | 105.4-135.8 | Ardakan | 2.8708 | 4.71 | 0.3219 |
| 3B-1 | wPt-11295-Xgwm566 | 388-406.1 | Ardakan | 3.1279 | 5.58 | -0.343 | |
| 6B-1 | wPt-743231-wPt-2498 | 47.9-68.5 | Ardakan | 3.1859 | 4.56 | 0.339 | |
| FLA | 2B-1 | wPt-3561-wPt-8072 | 11.9-17.2 | Yazd | 3.6184 | 4.31 | 53.56 |
| 4D | wPt-666459-wPt-672143 | 2.3-10.7 | Yazd | 3.6429 | 5.22 | -64.9438 | |
| 6B-1 | tPt-3689-wPt-8554 | 55.8-65.4 | Yazd | 3.3475 | 4.1 | 52.4582 | |
| 7B-1 | wPt-743486-wPt-8283 | 6.3-16.5 | Yazd | 3.1884 | 3.77 | -47.5711 | |
| 7A-1 | wPt-3226-wPt-2525 | 178-181.4 | Ardakan | 3.3082 | 3.88 | -35.2663 | |
| 7B-1 | wPt-743486-wPt-8283 | 7.1-16 | Ardakan | 4.2814 | 5.06 | -36.8172 | |
| WFL | 3A-1 | wPt-0549-wPt-9154 | 50.2-81.4 | Ardakan | 2.7151 | 11.82 | 0.0072 |
| 6B-1 | wPt-743231-wPt-2498 | 37.5-52 | Ardakan | 3.3394 | 4.43 | 0.0046 |
n.s,*** Not significant and significant at 0.001 probability level, respectively a Marker interval means the interval of the F value peak for QTLs
A total of 3 QTL on 3 chromosomes were identified for flag leaf width which were contributed by parents' alleles. The B genome had the largest number of QTLs (All QTL) for this trait. All of the QTLs were identified by QTL Cartographer software.
Of these QTLs for FLW, one which was located on chromosome 6B - 1(wPt-743231-wPt-2498), had the same location with a QTL affecting WFL in the Ardakan environment and explained 4.56 % of the phenotypic variation. Both QTLs were contributed by ‘Roshan’ alleles. Of the 3 putative QTLs for this trait, all of them were identified under salt stress environments (Ardakan). Both parental alleles contributed to the effect of flag leaf width under the salt stress environment.
This study identified seven QTL on 5 chromosomes for the flag leaf area which were contributed by parents' alleles. The B genome had the largest number of QTLs (5 QTL) for this trait. From these 7 QTLs, four of them were identified by QTL Cartographer software and only one on chromosome 7B-1 was identified in both environments and also it was identified in salt stress environment by QTLNetwork software.
One of these QTLs located on chromosome 2B - 1 (wPt-3561-wPt-8072) had the same location with a QTL for FLL in the Yazd environment and explained 4.31 % of the phenotypic variation. Both contributed by ‘Roshan’ alleles. Of the 6 putative QTLs identified by QTL Cartographer for this trait, one of them on chromosome 7B - 1 (wPt-743486-wPt-8283) was identified at the same position under normal and salt stress environments. Under normal environment, two QTLs for flag leaf area from Falat had a negative effect. For the others in this environment, Roshan alleles were associated with positive effects on flag leaf area. The Falat alleles contributed to the effect of flag leaf area under salt stress environment.
This study detected four QTL on 3 chromosomes for the flag leaf weight which were contributed by parents' alleles. Both the A and B genome had the same number of QTLs (2 QTL) for this trait. From these 4 QTL, two of them were identified by QTL Cartographer software and the rest were identified by QTL Network software.
One of them on chromosome 3A - 1 (wPt-0549-wPt-9154) was co-located with a QTL affecting FLL in the Ardakan environment and explained 11.82 % of the phenotypic variation and the other one on chromosome 6B - 1 (wPt-743231-wPt-2498) was co-located with a QTL affecting FLW. Both contributed by ‘Roshan’ alleles.
Blast result indicated that the sequence of a DArt marker (wPt-0549) which was linked to flag leaf length and weight of flag leaf QTLs in Ardakan environment in chromosome 3A - 1 showed this sequence located in 5B chromosome of Triticum aestivum and overlap with TraesCS5B02G481400 gene with 99.5 % of identity. According to Ensembl Plants results, wPt-0549 region could encode coding protein belonged to serpin family. Furthermore, we have also investigated on NCBI to find any similar sequences using blastn. Results showed that wPt-0549 is similar to HE774676.1 (contig ctg447) locus of Triticum aestivum located at the short arm of 3D chromosome with 98.98 % of identity. HE774676.1 locus could encode cytochrome P450 protein.
Mapping QTLs with different effects
To breed a physiologically efficient and productive wheat genotype, it would be helpful to know the epistatic gene actions operating in the inheritance of the physiological traits, such as flag leaf area [1]. We detected a pairs of epistatic effects using single-environment phenotypic value for one trait on 2 chromosomes (Table 2; Fig. 2) by composite interval mapping (CIM) analysis using QTLNetwork software. The single epistasis was identified for FLW. The FLW-3B1/FLW-6B1 epistasis resulted in decrease FLW in recombination type q1q1Q2Q2.
We also identified 2 QTLs for two traits on two chromosomes by the combined analysis of the multi-environment phenotypic values under normal and saline conditions, Both of the QTLs did not show interacting effects in the environment, explaining the phenotypic variation ranging between 1.07 to 3.32 % (Table 2). We also identified no pairs of epistatic effects for these traits.
We found one QTL for FLL on chromosome 4A - 1, which ‘Falat’ alleles contributed to this QTL. Also, we found only one QTL for FLA on chromosome 7B - 1 which ‘Roshan’ alleles contributed to this QTL
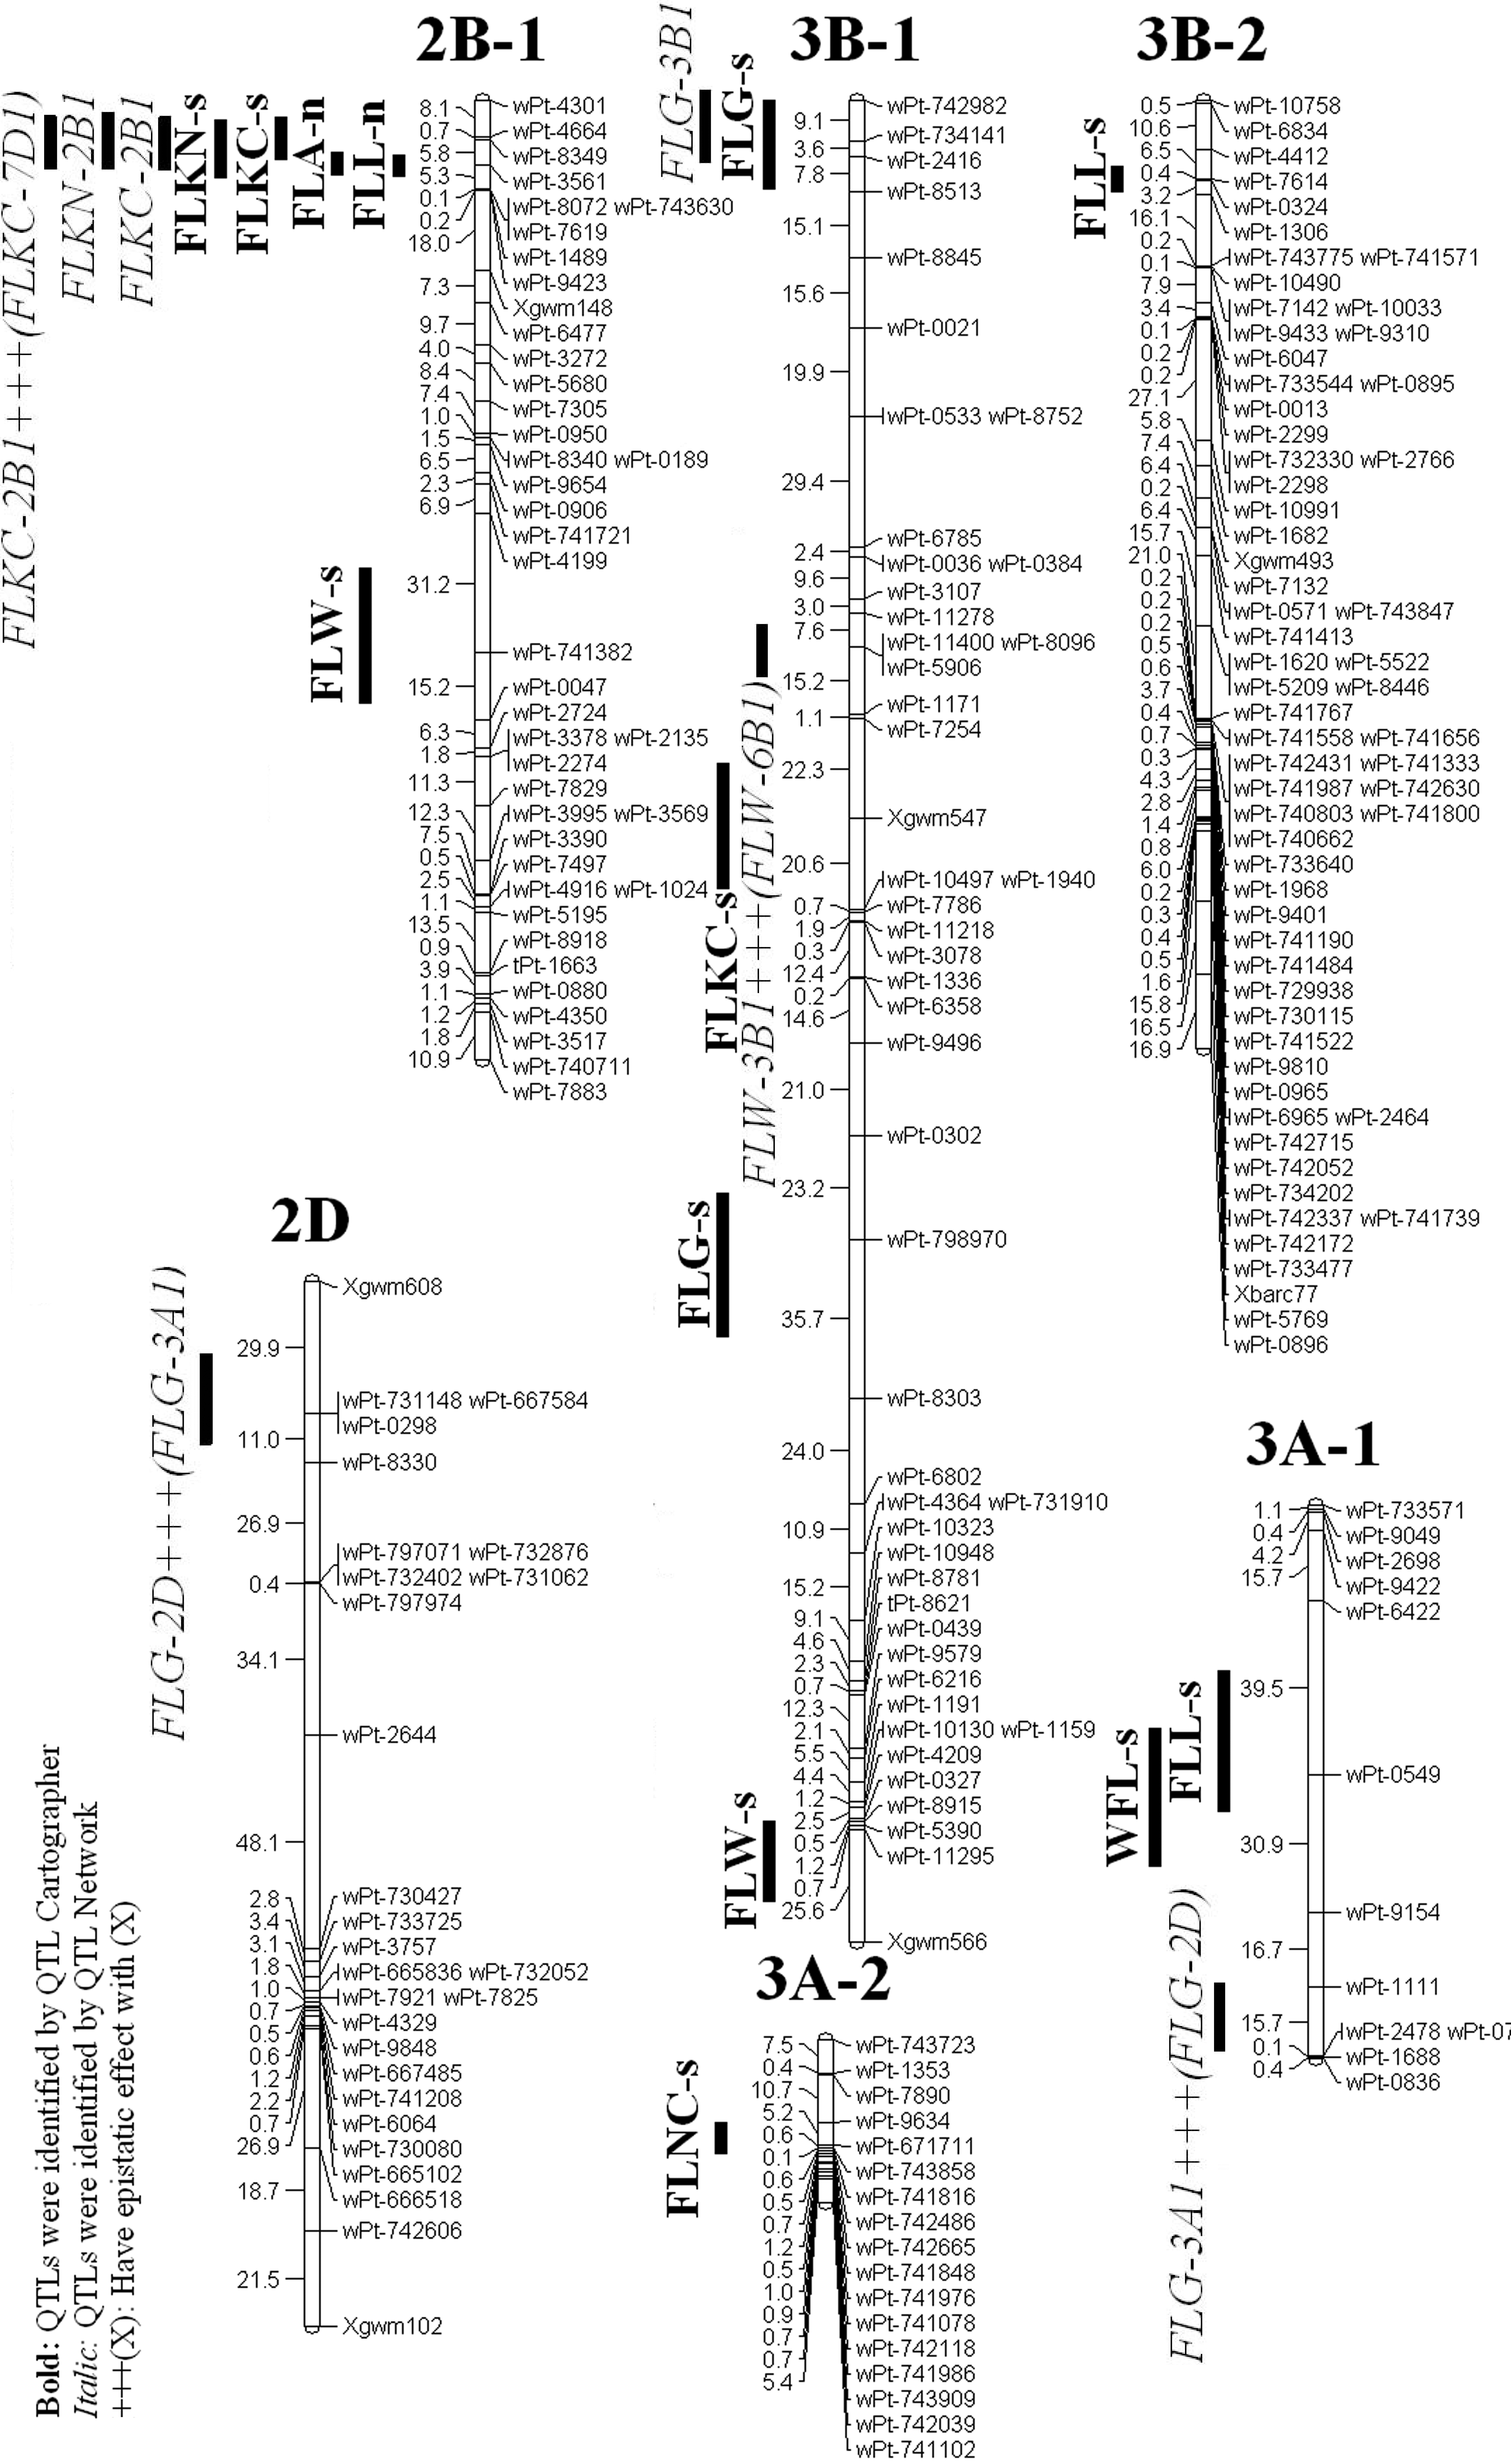
Figure 2: Location of QTLs for flag leaf traits on linkage groups.
Detecting QTLs cluster and pleiotropy
MCIM analysis using the individual environment data indicated 4 intervals on chromosomes 2B - 1, 3A - 1, 6B - 1 and 7B - 1 for additive QTLs. The interval wPt-3561-wPt-8072 on chromosome 2B - 1 affects FLL (N) and FLA (N), the interval wPt-0549-wPt-9154 on chromosome 3A - 1 affects FLL (S) and WFL (S), the interval wPt-743231-wPt-2498 on chromosome 6B - 1 affects FLW (S) and WFL (S), and the interval wPt-743486-wPt-8283 on chromosome 7B - 1 affects FLA (N) and FLA (S) (one trait in the both treatments).
Discussion
Relationships among the flag leaf traits and salt tolerance
Different physiological mechanisms play a role in salt tolerance and are controlled at different stages of the growth cycle [49-51]. A complete list of traits and methods used to evaluate salt tolerance has been reviewed elsewhere [52]. Flag leaf has an important role in cereals like wheat, because it provides the maximum amount of photosynthesis assimilates to be stored in the grains. It seems that flag leaf with higher length had higher width. Also, we found a positive and significant correlation between FLA with FLL and FLW in both environments, which was in good agreement with [53]. Other researchers found similar relationship between FLL and FLW [6, 38, 53] . A greater flag leaf area will eventually help to increase the photosynthetic efficiency by increasing the production of photosynthesis, which is then translocated into grains and increase their weight. Therefore, flag leaf area has a direct relationship to seed yield [54]. As indicated in the results, there was a significant correlation between FLW and seed yield in stress environment, which was in good agreement with [6].
[25] reported that salinity reduces the leaf area. The morphological traits of flag leaves, including length, width and area are inherited quantitatively and influenced greatly by the environments [55, 33-34] A positive and significant correlation was found between FLA and plant height in stress environment, which was in good agreement with other studies [15, 56, 57]. Furthermore, other researchers found similar relationships between FLL, FLW and FLA with spike length, number of fertile spikelets per spike and total spikelet per spike similar to our results [15, 57].
Roshan is a salt tolerant cultivar and its flag leaf traits include FLL, FLW, FLA and WFL were higher than Falat.
However, in this study there was a positive relationship between seed yield and leaf area in the stress environment. This positive and significant association of flag leaf area with seed yield suggested the importance of flag leaf area in evolving superior genotypes [57]. It has been proved that the flag leaf, stem and head are the closest source to the grain. The flag leaf could produce a large proportion of the carbohydrates stored in grains [10-12]. Therefore, flag leaf is one of the important components in determining seed yield potential in cereal and plays a major role in increasing productivity [14]. Physiological studies of wheat have shown that flag leaf contribution towards grain weight accounts for 41- 43 % of dry matter in the kernel at maturity and is the major photosynthetic site during the grain filling stage [58]. Several researchers observed a positive correlation between seed yield and FLA [15, 54, 53, 59, 60]. Therefore, the flag leaf area has a direct relationship to seed yield [54].
Relationships between flag leaf QTLs
The analysis of the QTL controlling morphological traits of flag leaf has been intensively studied before in some cereal [19, 20, 23, 33, 34, 37, 61-65]. However, genetic control of flag leaf traits in saline environment has been reported somewhat in wheat up to date.
[36, 23, 38, 66] observed a QTL controlling FLW (flag leaf width) on chromosome 5A, [12] observed 3 QTLs controlling FLW on chromosomes 1B and 4B, [67] detected eight QTLs for FLW on 1A, 1B, 3A, 4D, 5A, 5D, and 7D, [11] detected 4 QTLs on chromosomes 1A, 1B, 5A and 7A for FLW,. Also In barley, there is a major FLW QTL in chromosome 5H [34,68]. In the present study, we detected 3 QTLs on chromosomes 2B - 1, 3B - 1 and 6B - 1 for flag leaf width. The roles and relations between QTLs are influenced by epistatic effects and pleiotropy; As a result, one minor QTL may have a great impact on regulatory pathways [69].
[38] detected 7 chromosome regions for flag leaf length on chromosomes 1B, 2B, 2D,3B, 4A, 5B, 6D in wheat, [7] detected three QTLs on chromosomes2D, 4D, and 5B for
FLL, [67] detected three QTLs for FLL on 1A, 5B, and 6A, [68] detected 3 QTLs for flag leaf length on chromosomes
2 QTLs for flag leaf length on the chromosomes 5H and 7H. In the present study, we also detected 5 QTLs on chromosomes 2B - 1, 3A - 1, 3B - 2, 5D and 7B - 1 for flag leaf length.
There is a strong need to understand the extent of the epistasis and QTL × environment (QE) interactions in QTL studies. Several studies have shown the interaction between two or more QTLs and/ or between QTL and the environment as well as the identification of their additive effects [71 - 72]. However, there are few reports on the identification of the epistatic and Q × E interactions under salt stress conditions, especially for the flag leaf traits in wheat. To date, wheat researchers have identified different QTLs with epistatic and Q × E effects for both physiological and biomass traits [71]. In the present study we could find three pairs of epistatic effects using single-environment phenotypic value for three traits.
QTL co-location and traits correlation
QTL clusters or co-located QTLs for different traits in salinity conditions have been reported in previous studies [50,72]. Masoudi et al. (2015) have reported six cluster on chromosomes 1B, 2B (two), 3B (two) and 6B which are at least relevant with two different traits. Also co-located QTL for flag leaf-related traits have been observed by previous researchers in wheat [19,38,39].
In the present study, three intervals were identified on chromosomes 2B - 1, 3A - 1 and 6B - 1, which had an effect on more than one trait. For each of the three loci, the relationships between related traits in these clusters were consistent with the additive effects of the corresponding QTLs. All three intervals had a similar additive effect for the two relevant traits, and the correlation coefficients between most of these traits were significant and positive. As already mentioned, each cluster may be a single locus or several loci linked tightly together [50,71,74]. Four chromosome intervals which either affected more than one trait (pleiotropy) or affected a trait in both N and S environments were identified by MCIM analysis. These co-localized QTLs were located on chromosomes 2B - 1, 3A - 1, 6B - 1 and 7B - 1, and they may be single loci that affect more than one trait.
Molecular aspects of locus link to flag leaf traits QTLs
We have observed that wPt-0549 is belonged to the part of sequence that could encode serpin protein. It has been shown that serpin family is responsive to environmental stress. Serpin gene showed up-regulation under salt stress in root tissues [75]. On the other hand, It has been also shown that Serpin gene interact with RD21 which induced by salt stress in senescing leaves and stressed leaf tissues [76-80]. Furthermore, we have also observed that wPt-0549 is also related to cytochrome P450 protein. It has been shown that cytochrome P450 genes were up-regulated during wheat flag leaf senescence [81]. Our results indicated that wPt-0549 marker which is a part of serpin and cytochrome P450 genes region showed a significant correlation with flag leaf characteristics under salinity stress condition. It has been shown that these two genes are involved in leaf senescing. Therefore, it could be concluded that serpin and cytochrome P450 genes (which are consist of wPt-0549) induce leaf senescing through their up-regulation under salinity stress.
Conclusions
In this study, using a high-density DArT and SSR linkage map, 16 additive QTLs were detected in Yazd and Ardakan to control the morphology of wheat flag leaf. One stable QTL identified for flag leaf area in the interval wPt-743486-wPt-8283 on chromosome 7B - 1. The results showed that most of the detected QTLs in the two conditions did not have interactions with the environment. In this study, a pairs of QTLs with epistatic effects (AA) were identified for flag leaf width.
Acknowledgements
This research was supported by Agricultural Biotechnology Research Institute of Iran (ABRII).
References
- Sharma S, Sain R, Sharma R. (2003) Genetic analysis of flag leaf area in durum wheat [triticum durum] over environments. Wheat Information Service (Japan). [Ref.]
- Cui K, Peng S, Xing Y, Yu S, Xu X, et al. (2003) Molecular dissection of the genetic relationships of source, sink and transport tissue with yield traits in rice. Theoretical and Applied Gen. 106: 649-658. [Ref.]
- Sourdille P, Cadalen T, Gay G, Gill B, M. Bernard. (2002) Molecular and physical mapping of genes affecting awning in wheat. Plant Breeding. 121(4): 320-324. [Ref.]
- Pérez P, J M, Bruna E, Micol JL. (2010) Qtl analysis of leaf architecture. Journal of plant research. 123(1): 15-23. [PudMed.]
- Voldeng HD , Simpson G. (1967) The relationship between photosynthetic area and grain yield per plant in wheat. Canadian Journal of Plant Science. 47(4): 359-365. [Ref.]
- Dere S, Yildirim MB. (2006) Inheritance of grain yield per plant, flag leaf width, and length in an 8 x 8 diallel cross population of bread wheat (t. Aestivum l.). Turk J Agric For. 30(5): 339-345. [Ref.]
- Liu K, Xu H, Liu G, Guan P, Zhou X,et al. (2018) Qtl mapping of flag leaf-related traits in wheat (triticum aestivum l.). Theoretical and Applied Genetic. 131(4): 839-849. [Ref.]
- Foyer C. (1987) The basis for source-sink interaction in leaves. Plant Physiology and Biochemistry. 25(5): 649-657. [Ref.]
- Hirota O, Oka M ,Takeda T. (1990) Sink activity estimation by sink size and dry matter increase during the ripening stage of barley (hordeum vu/gare) and rice (oryza sativa). Annals of Botany. 65(4): 349-353. [Ref.]
- Li Z, Pinson SR, Stansel JW, Paterson AH. (1998) Genetic dissection of the source-sink relationship affecting fecundity and yield in rice (shape oryza sativa l.). Molecular Breeding. 4(5): 419-426. [Ref.]
- Hussain W, Baenziger PS, Belamkar V, Guttieri MJ, Venegas JP,et al. (2017) Genotyping-by-sequencing derived high-density linkage map and its application to qtl mapping of flag leaf traits in bread wheat. Scientific Reports. 7(16394): 1-15. [Ref.]
- Liu Y, Tao Y, Wang Z, Guo Q, Wu F,et al. (2018) Identification of qtl for flag leaf length in common wheat and their pleiotropic effects. Molecular Breeding. 38(1): 11. [Ref.]
- Lupton F. (1973) Selection criteria determining yield in semi dwarf wheat varieties. Ann Appl Biol. 72: 47-50. [Ref.]
- Rao PS. (1991) Influence of source and sink on the production of high density grain and yield in rice. Indian J Plant Physiol. 34: 339- 348. [Ref.]
- Amiri RS, Bahraminejad S, Honarmand SJ. (2013) Effect of terminal drought stress on grain yield and some morphological traits in 80 bread wheat genotypes. Int J Agri Crop Sci. 5(10): 1145-1153. [Ref.]
- Sharma S, Sain R, Sharma R. (2003) The genetic control of flag leaf length in normal and late sown durum wheat. The Journal of Agricultural Science. 141(3-4): 323-331. [Ref.]
- Verma V, Foulkes M, Worland A, Bradley RS, Caligari P,et al. (2004) Mapping quantitative trait loci for flag leaf senescence as a yield determinant in winter wheat under optimal and drought-stressed environments. Euphytica. 135(3): 255-263. [Ref.]
- Kobayashi S, Fukuta Y, Morita S, Sato T, Osaki M,et al. (2003) Quantitative trait loci affecting flag leaf development in rice (oryza sativa l.). Breeding science. 53(3): 255-262. [Ref.]
- Fan X, Cui F, Zhao C, Zhang W, Yang L,et al. (2015) Qtls for flag leaf size and their influence on yield-related traits in wheat (triticum aestivum l.). Molecular Breeding. 35(1): 24. [Ref.]
- Mei H, Luo L, Ying C, Wang Y, Yu X,et al. (2003) Gene actions of qtls affecting several agronomic traits resolved in a recombinant inbred rice population and two testcross populations. Theoretical and Applied Genetics. 107(1): 89-101. [PubMed.]
- Khaliq I, Irshad A, Ahsan M. (2008) Awns and flag leaf contribution towards grain yield in spring wheat (triticum aestivum l.). Cereal Research Communications. 36(1): 65-76. [Ref.]
- Wang P, Zhou G, Yu H,Yu S. (2011) Fine mapping a major qtl for flag leaf size and yield-related traits in rice. Theoretical and Applied Genetics. 123(8): 1319-1330. [Ref.]
- Xue S, Xu F, Li G,. Zhou Y, Lin M,et al. (2013) Fine mapping taflw1, a major qtl controlling flag leaf width in bread wheat (triticum aestivum l.). Theoretical and Applied Genetics. 126(8): 1941-1949. [Ref.]
- Greenway H, Munns R. (1980) Mechanisms of salt tolerance in nonhalophytes. Annual review of plant physiology. 31(1): 149-190. [Ref.]
- Singh B, Singh D. (1994) Effect of moisture stress on morphological parameters and productivity of poaceous crops. Agro Botanical Publishers India, Bikaner. [Ref.]
- James RA, Blake C, Byrt CS, Munns R. (2011) Major genes for na+ exclusion, nax1 and nax2 (wheat hkt1; 4 and hkt1; 5), decrease na+ accumulation in bread wheat leaves under saline and waterlogged conditions. Journal of Experimental Botany, 62(8): 2939-2947. [PubMed.]
- Tanksley SD. (1993) Mapping polygenes. Annual review of genetics. 27(1): 205-233. [Ref.]
- Malmberg RL, Held S, Waits A, Mauricio R. (2005) Epistasis for fitness-related quantitative traits in arabidopsis thaliana grown in the field and in the greenhouse. Genetics. 171(4): 2013-2027. [Ref.]
- Carlborg Ö, Jacobsson L, Åhgren P, Siegel P, Andersson L. (2006) Epistasis and the release of genetic variation during long-term selection. Nature genetics. 38(4): 418-420. [PubMed.]
- Shen X, Zhang T, Guo W, Zhu X, Zhang X. (2006). Mapping fiber and yield qtls with main, epistatic, and qtl× environment interaction effects in recombinant inbred lines of upland cotton. Crop science. 46(1): 61-66. [Ref.]
- Würschum T, Maurer HP, Schulz B, Möhring J, Reif JC. (2011) Genome-wide association mapping reveals epistasis and genetic interaction networks in sugar beet. Theoretical and Applied Genetics. 123(1): 109-118. [PubMed.]
- Mei H, Li Z, Shu Q, Guo L, Wang Y,et al. (2005) Gene actions of qtls affecting several agronomic traits resolved in a recombinant inbred rice population and two backcross populations. Theoretical and Applied Genetics. 110(4): 649-659. [PubMed.]
- Yue B, Xue WY, Luo LJ, Xing YZ. (2006) Qtl analysis for flag leaf characteristics and their relationships with yield and yield traits in rice. Acta Genetica Sinica. 33(9): 824-832. [PubMed.]
- Xue DW, Chen MC, Zhou MX, Chen S, Mao Yet al. (2008) Qtl analysis of flag leaf in barley (hordeum vulgare l.) for morphological traits and chlorophyll content. Journal of Zhejiang University SCIENCE B. 9(12): 938-943. [Ref.]
- Farooq M, Tagle AG, Santos RE, Ebron LA, Fujita D,et al. (2010) Quantitative trait loci mapping for leaf length and leaf width in rice cv. Ir64 derived lines. Journal of Integrative Plant Biology. 52(6): 578-584. [Ref.]
- Jia H, Wan H, Yang S, Zhang Z, Kong Z,et al. (2013) Genetic dissection of yield-related traits in a recombinant inbred line population created using a key breeding parent in china’s wheat breeding. Theoretical and Applied Genetics. 126(8): 2123-2139. [PubMed.]
- Liu L, Sun G, Ren X, Li C, Sun D. (2015) Identification of qtl underlying physiological and morphological traits of flag leaf in barley. BMC genetics. 16(1): 29. [Ref.]
- Wu Q, Chen Y, Fu L, Zhou S, Chen J,et al. (2016) Qtl mapping of flag leaf traits in common wheat using an integrated high-density ssr and snp genetic linkage map. Euphytica. 208(2): 337-351. [Ref.]
- Yang D, Liu Y, Cheng H, Chang L, Chen J, Chai S, Li M. (2016) Genetic dissection of flag leaf morphology in wheat (triticum aestivum l.) under diverse water regimes. BMC genetics. 17(1): 1-15. [Ref.]
- Yang J, Hu C, Ye X, Zhu J. (2005) Qtlnetwork 2.0. Institute of Bioinformatics, Zhejiang University, Hangzhou, China . [PubMed.]
- Poustini K, Siosemardeh A. (2004) Ion distribution in wheat cultivars in response to salinity stress. Field Crops Research. 85(2): 125-133. [Ref.]
- Zhang H, Schroder J, Pittman J, Wang J, Jim W, et al.(2005) Soil Salinity Using Saturated Paste and 1:1 Soil to Water Extracts. Soil Sci Society Am J. 69. [Ref.]
- Muller J.(1991) Determining leaf surface area by means of linear measurements in wheat and triticale (brief report). Archiv fuchtungsforschung. 21(2): 121-123. [Ref.]
- Masoudi B, Mardi M, Hervan EM, Bihamta MR, Naghavi MR, et al. (2015) Qtl mapping of salt tolerance traits with different effects at the seedling stage of bread wheat. Plant Molecular Biology Reporter. 33(6): 1790-1803. [Ref.]
- Jiang C, Zeng ZB. (1995) Multiple trait analysis of genetic mapping for quantitative trait loci. Genetics. 140(3): 1111-1127. [PubMed.]
- Yang J, Zhu J, Williams RW. (2007) Mapping the genetic architecture of complex traits in experimental populations. Bioinformatics. 23(12): 1527-1536. [Ref.]
- Yang J, Hu C, Hu H, Yu R, Xia Z,et al. (2008) Qtlnetwork: Mapping and visualizing genetic architecture of complex traits in experimental populations. Bioinformatics. 24(5): 721-723. [PubMed.]
- Masoudi B, Mardi M, Hervan EM, Bihamta MR, Naghavi MR,et al. (2019) Study of qtls linked to awn length and their relationships with chloroplasts under control and saline environments in bread wheat. Genes & genomics. 41(2): 223-231. [PubMed.]
- Mano Y,Takeda K. (1997) Mapping quantitative trait loci for salt tolerance at germination and the seedling stage in barley (hordeum vulgare l.). Euphytica. 94(3): 263-272. [Ref.]
- Ma L, Zhou E, Huo N, Zhou R, Wang G,et al. (2007) Genetic analysis of salt tolerance in a recombinant inbred population of wheat (triticum aestivum l.). Euphytica. 153(1-2): 109-117. [Ref.]
- Munns R, Tester M. (2008) Mechanisms of salinity tolerance. Annu. Rev. Plant Biol. 59: 651-681. [Ref.]
- Munns R, James RA. (2003) Screening methods for salinity tolerance: A case study with tetraploid wheat. Plant and Soil. 253(1): 201-218. [Ref.]
- Singh G, Chaudhary H, Yadav R. (2008) Genetics of flag leaf angle, width, length and area in bread wheat (triticum aestivum). Indian journal of agricultural science, 78(5): 436-438. [Ref.]
- Riaz R, Chowdhry MA. (2003) Genetic analysis of some economic traits of wheat under drought condition. Asian J. Plant Sci. 2: 790-796. [Ref.]
- Coleman R, Gill GS, Rebetzke G. (2001) Identification of quantitative trait loci for traits conferring weed competitiveness in wheat (triticum aestivum l.). Crop and Pasture Science. 52(12): 1235-1246. [Ref.]
- Subhani GM, Chowdhry MA. (2000) Correlation and path coefficient analysis in bread wheat under drought stress and normal conditions. Pakistan J. Biol. Sci. 3: 72-77. [Ref.]
- Iftikhar R, Khaliq I, IjazM, Rashid MAR. (2012) Association analysis of grain yield and its components in spring wheat (triticum aestivum l.). [Ref.]
- Ibrahim H, Elenein RA. (1977) The relative contribution of different wheat leaves and awns to the grain yield and its protein content. Zeitschrift fuer Acker und Pflanzenbau. 144. [Ref.]
- Kashif M, Khaliq I. (2004) Heritability, correlation and path coefficient analysis for some metric traits in wheat. International Journal of Agriculture & Biology. 6(1): 138-142. [Ref.]
- Ali M, Abbas A, Awan S, Jabran K, Gardezi G. (2011) Correlated response of various morpho-physiological characters with grain yield in sorghum landraces at different growth phases. J Animal Plant Sci. 21(4): 671-679. [Ref.]
- Causse M, Rocher J, Henry A, Charcosset A, Prioul J,et al. (1995) Genetic dissection of the relationship between carbon metabolism and early growth in maize, with emphasis on key-enzyme loci. Molecular Breeding. 1(3): 259-272. [Ref.]
- Kang HJ, Cho YG, Lee YT, Eun MY. (1999) Mapping qtls for flag leaf length and width, panicle exertion length, and awn length using recombinant inbred population of rice (oryza sativa l.). Plant & Animal Genome VII Conference. Town & Country Hotel, San Diego: p.309. [Ref.]
- Li SG, He P, Wang YP, Li HY, Chen Y,et al. (2000) Genetic analysis and gene mapping of the leaf traits in rice (oryza sativa l.). Acta Agronomica Sinica. 26(3): 261-265 (in Chinese). [Ref.]
- Su JY, Tong YP, Liu QY, Li B, Jing RL,et al. (2006) Mapping quantitative trait loci for post anthesis dry matter accumulation in wheat. Journal of Integrative Plant Biology. 48(8): 938-944. [Ref.]
- Li H, Wang G, Zheng Q, Li B, Jing R,et al. (2014) Genetic analysis of biomass and photosynthetic parameters in wheat grown in different light intensities. Journal of Integrative Plant Biology. 56(6): 594-604. [PubMed.]
- Ma Z, Xue S, Lin F, Yang S, Li G,et al. (2008) Mapping and validation of scab resistance qtls in the nanda2419 x wangshuibai population. Cereal Res Commun. 36(Suppl B): 245–251. [Ref.]
- Yan X, Zhao L, Ren Y, Zhang N, Dong Z, et al. (2020) Identification of genetic loci and a candidate gene related to flag leaf traits in common wheat by genome-wide association study and linkage mapping. Molecular Breeding. 40(6): 1-15. [Ref.]
- Gyenis L, Yun asj, Smith KP, Steffenson BJ, Bossolini E,et al. (2007) Genetic architecture of quantitative trait loci associated with morphological and agronomic trait differences in a wild by cultivated barley cross. Genome. 50(8): 714-723. [Ref.]
- Koyama ML, Levesley A, Koebner RM, Flowers TJ, Yeo AR. (2001) Quantitative trait loci for component physiological traits determining salt tolerance in rice. Plant Physiology. 125(1): 406-422. [Ref.]
- Malmberg RL, Mauricio R. (2005) Qtl-based evidence for the role of epistasis in evolution. Genetical Research. 86(2): 89-96. [PubMed.]
- Xu YF, An DG, Liu DC, Zhang AM, Xu HX, et al. (2012) Mapping qtls with epistatic effects and qtl× treatment interactions for salt tolerance at seedling stage of wheat. Euphytica. 186(1): 233-245. [Ref.]
- Genc Y, Oldach K, Verbyla AP, Lott G, Hassan M,et al. (2010) Sodium exclusion qtl associated with improved seedling growth in bread wheat under salinity stress. Theoretical and Applied Genetics. 121(5): 877-894. [PubMed.]
- Veldboom L, Lee M, Woodman W. (1994) Molecular marker-facilitated studies in an elite maize population: I. Linkage analysis and determination of qtl for morphological traits. Theoretical and Applied Genetics. 88(1): 7-16. [PubMed.]
- Paterson AH. (1995) Molecular dissection of quantitative traits: Progress and prospects. Genome Research. 5(4): 321-333. [PubMed.]
- Fluhr R, Lampl N, Roberts TH. (2012) Serpin protease inhibitors in plant biology. Physiologia plantarum. 145(1): 95-102. [PubMed.]
- Koizumi M, Shinozaki KY, Tsuji H, Shinozaki K. (1993) Structure and expression of two genes that encode distinct drought-inducible cysteine proteinases in arabidopsis thaliana. Gene. 129(2): 175-182. [PubMed.]
- Harrak H, Azelmat S, Baker EN, Tabaeizadeh Z. (2001) Isolation and characterization of a gene encoding a drought-induced cysteine protease in tomato (lycopersicon esculentum). Genome. 44(3): 368-374. [PubMed.]
- Hayashi Y, Yamada K, Shimada T, Matsushima R, Nishizawa N,et al. (2001) A proteinase-storing body that prepares for cell death or stresses in the epidermal cells of arabidopsis. Plant and Cell Physiology. 42(9): 894-899. [PubMed.]
- Matsushima R, Hayashi Y, Yamada K, Shimada T, Nishimura M.et al. (2003) The er body, a novel endoplasmic reticulum-derived structure in arabidopsis. Plant and Cell Physiology. 44(7): 661-666. [PubMed.]
- Chen HJ, Huang DJ, Hou WC, Liu JS, Lin YH. (2006) Molecular cloning and characterization of a granulin-containing cysteine protease spcp3 from sweet potato (ipomoea batatas) senescent leaves. Journal of plant physiology. 163(8): 863-876. [PubMed.]
- Gregersen PL, Holm PB. (2007) Transcriptome analysis of senescence in the flag leaf of wheat (triticum aestivum l). Plant Biotechnology Journal. 5(1): 192-206. [PubMed.]