>Corresponding Author : Emmanuel Israel Edache
>Article Type : Research Article
>Volume : 2 | Issue : 2
>Received Date : 13 March, 2022
>Accepted Date : 27 March, 2022
>Published Date : 30 March, 2022
>DOI : https://doi.org/10.54289/JVVD2200106
>Citation : : Edache EI, Uzairu A, Mamza PA, Shallangwa GA. (2022) A 2D-QSAR, Homology Modeling, Docking, ADMET, and Molecular Dynamics Simulations Studies for Assessment of a Novel SARS-Cov-2 and Pseudomonas Aeruginosa Inhibitors. J Virol Viral Dis 2(2): doi https://doi.org/10.54289/JVVD2200106
>Copyright : © 2022 Edache EI, et al. This is an open-access article distributed under the terms of the Creative Commons Attribution License, which permits unrestricted use, distribution, and reproduction in any medium, provided the original author and source are credited.
Research Article | Open Access
1Department of Pure and Applied Chemistry, University of Maiduguri, Borno State, Nigeria 2Department of Chemistry, Ahmadu Bello University, P.M.B. 1044, Zaria, Nigeria
*Corresponding author: Emmanuel Israel Edache, Department of Pure and Applied Chemistry, University of Maiduguri, Borno State, Nigeria
Abstract
Pseudomonas aeruginosa and SARS-CoV-2 are two of the world's most hazardous diseases. Treatments that target the enzyme or protein could be more successful and efficient. In this study, iminoguanidine derivatives were treated to a combination of five [5] computational assessments in the: 2D-QSAR, homology modeling, docking simulation, ADMET evaluation, and molecular dynamics simulations [MDs simulations]. A dataset of 25 iminoguanidine compounds was used in the QSAR analysis, giving a statistically robust and highly predictive model. The created model has been thoroughly validated and meets various statistical parameter thresholds. The interactions between Chloroquine and Azithromycin, a potentially and commonly used antimalarial and antibacterial medication, and the postulated iminoguanidine derivatives with the SARS-CoV-2 main nucleocapsid phosphoprotein were investigated using the docking simulation. The docking data demonstrate that the novel compound 18 has a high level of stability in the SARS-CoV-2 active site as well as a high binding affinity for the heme oxygenase receptor. The rules of five, rule of two, toxicity, and metabolism were used to screen these compounds for suitable fragments and pharmacological properties. Predictions of pharmacological properties suggested that compound 18 could be a promising therapeutic candidate for Pseudomonas aeruginosa and SARS-CoV-2.
Introduction:
The coronavirus disease pandemic (covid-19) has wreaked havoc on global supply systems, resulting in a dramatic decline in global crude oil prices, global stock, and financial market volatility, large-scale cancellations of sporting and entertainment events, and restrictions on large-scale migrations of people in numerous countries, and intercontinental travel bans and restrictions have been imposed on key flight routes around the world [1]. SARS was declared eradicated in July 2003, although the risk of pandemic SARS-CoV re-emergence remains [2]. The new SARS strain (SARS-CoV-2) is more virulent than the one that caused the 2003 and 2019 outbreaks [3]. This recent epidemic of a new strain of Coronavirus (SARS-CoV-2) has caused deaths around the world [4]. High temperature, malaise, myalgia, headache, non-productive cough, diarrhoea, and shivering are among the symptoms [3]. With over 112,305,539 confirmed and 2,486,641 death cases documented so far (https://coronavirus.jhu.edu/map.html), the number of confirmed and death cases is increasing daily. Pseudomonas aeruginosa (P. aeruginosa) on other hand is a virulent opportunistic pathogen that needs iron to survive [5,6]. The heme assimilation system (Has) and Pseudomonas heme uptake (Phu) systems allow Pseudomonas aeruginosa to obtain iron from heme [7]. Pseudomonas aeruginosa have evolved powerful sensing and integrating energy systems to sense critical environmental conditions and alter virulence gene expression to allow infection to succeed [8]. This bacterial is a primary cause of death in cystic fibrosis patients with persistent bronchitis, infects cancer patients who are malnourished, and is one of the most common causative organisms causing ventilator-associated pneumonia and nosocomial bacteremia [9]. The attributable mortality rate of P. aeruginosa is very high. Since the COVID-19 pandemic, treating nosocomial ventilator-associated pneumonia has become crucial, particularly when early investigations have identified P. aeruginosa as one of the most common bacterial infections in COVID-19 patients [9-11]. These diseases can evolve novel resistance mechanisms and can pass genetic materials on to other diseases, allowing them to develop resistance to drugs as well [12]. Some SARS-CoV-2 entry and replication inhibitors have been identified in early studies [13]. The multifunctional protein nucleoprotein (NP) is involved in many aspects of the viral life cycle, including viral replication, transcription, RNA encapsidation, the mobilization of ribonucleoprotein complexes to viral budding sites, and the inhibition of the host cell interferon response [14]. The nucleocapsid phosphoprotein and heme oxygenase, respectively, are essential for viral and bacterial replication. Inhibiting SAR-CoV-2 and P. aeruginosa via the nucleocapsid phosphoprotein and heme oxygenase could be a lucrative drug target. The activity of the nucleocapsid phosphoprotein and heme oxygenase could be inhibited, preventing virus and bacterial replication inside infected cells. Structure-Based Drug Design (SBDD), a direct design that is used when the target's spatial structure is known, and Ligand Based Drug Design (LBDD), an indirect design used when the target's structure is unknown, are the two major methodologies and strategies used in Computer-Aided Drug Design (CADD) [15]. Molecular docking and de-novo design are the two broad categories of SBDD. If the desired molecular target can be isolated and crystallized, the molecular docking process is followed [16]. It's best to crystallize the protein with a ligand (cocrystal ligand), as this aids in the identification of the binding [active] site [17]. A binding site is a region of a protein that has the size, geometry, and functionalities that the ligand requires. This aids in the analysis of ligand-active-site amino acid interactions [18].
The knowledge of analog molecules that bind to a biological target of interest is used in Ligand-Based Drug Design (LBDD) [19]. These analogs are used to create a pharmacophore model, which specifies the structural characteristics that a molecule must have to bind to its target [20]. Quantitative Structure-Activity Relationship (QSAR) is another method for determining a link between the calculated properties of molecules and experimentally determined biological activity [21].
The strict in silico (computer-aided drug design) instructions can help prevent the spread of these diseases if they are followed. In silico (computer-aided drug design) forecasts, on the other hand, are gaining popularity in the field of drug evaluation. As a result of this in silico approach, several pharmacological inhibitors have been identified [22]. The computer-aided drug design [CADD] (i.e., Quantitative structural activity-relationship, molecular docking, molecular dynamics simulations, and ADMET) can help in screening out the few drugs in the treatment of these diseases [23,24]. Many previous studies have attempted to identify drug targets for an infectious disease like Covid-19 and Pseudomonas aeruginosa using QSAR, CoMFA, ADMET, and molecular dynamics simulations [25,26], comparative genomics, multi-omics approach, or subtractive genomics approach, and have been successful in identifying a significant number of potential drug targets [27].
We use quantitative structure-activity relationship (QSAR) modelling to assess a variety of iminoguanidine derivatives as potential P. aeruginosa therapeutics in this study. By optimizing and confirming the relationship between a substance and its chemical properties, this strategy is one of the most versatile and effective methodologies in the field of drug design and molecular modelling [28]. We use molecular docking on the drug like-protein complex to find the binding site, as well as the orientation pose of the drugs like with the receptor. Molecular dynamics (MD) simulations of the drug-like-protein complex are undertaken to establish that the complex generated by molecular docking is stable in the water solvent. MD simulation trajectories are used to see the complex's binding energy interactions. The variety of computational techniques, such as QSAR, molecular docking, ADMET, and MD simulations, is expected to not only provide a better understanding of complex interactions but also to have significant implications for the development of more potent SARS-CoV-2 and P. aeruginosa medications.
Methods
Data gathering and analysis of the protein domain family
The inhibitor activities of 25 iminoguanidine derivatives against P. aeruginosa were gathered from the PubChem database with the accession number AID_1315712. All 3D structures were created and built by the MarvinView program to anticipate the link between activity and various parameters and to develop a multiple linear regression model. Table S1 shows the architectures of the compounds investigated together with their activity pMIC50 (pMIC50 = -Log (MIC50)) values.
Table S1. The 2D structures of the 25 iminoguanidine derivatives with their docking binding scores.
| Cpd No. | PubChem access number AID_131512 | -LogMIC50 | Binding affinity (kcal/mol) | |
|---|---|---|---|---|
| Structures | pMIC50 | CoV-19 | PA | |
| 1 |  | 1.69019608 | -5.6 | -6.4 |
| 2 |  | 2.08278537 | -5.5 | -6.4 |
| 3 |  | 2.089905111 | -6.1 | -6.4 |
| 4 |  | 1.997823081 | -5.5 | -6.4 |
| 5 | 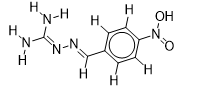 | 1.862131379 | -5.8 | -6.4 |
| 6 | 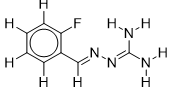 | 2.117933835 | -5.6 | -6.7 |
| 7 | 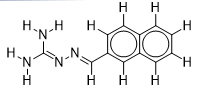 | 1.684845362 | -6.5 | -7.9 |
| 8 | 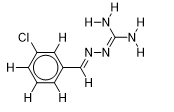 | 1.719331287 | -5.8 | -6.4 |
| 9 |  | 1.674861141 | -5.6 | -6.7 |
| 10 |  | 1.718501689 | -6.3 | -6.9 |
| 11 |  | 2.053078443 | -5.6 | -6.1 |
| 12 |  | 1.506505032 | -6.6 | -7.8 |
| 13 |  | 2.209515015 | -5.7 | -6.6 |
| 14 |  | 1.720159303 | -5.5 | -6.2 |
| 15 |  | 1.365487985 | -7.1 | -7.8 |
| 16 |  | 1.699837726 | -5.9 | -6.6 |
| 17 |  | 1.90579588 | -5.3 | -6.8 |
| 18 |  | 1.771587481 | -7.4 | -7.9 |
| 19 |  | 3.056904851 | -5.9 | -6.6 |
| 20 |  | 2.610660163 | -5.6 | -6.7 |
| 21 | 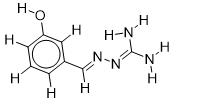 | 2.875061263 | -5.7 | -6.5 |
| 22 | 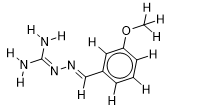 | 2.127104798 | -5.8 | -6.4 |
| 23 | 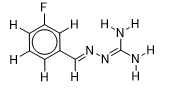 | 1.823474229 | -6 | -6.5 |
| 24 |  | 1.710117365 | -6.1 | -6.5 |
| 25 | 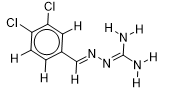 | 1.509202522 | -5.6 | -6.8 |
| Chloroquine PubChem CID: 2719 |  | ----- | -4.7 | -5.7 |
| Zithromax PubChem CID: 447043 |  | ----- | ----- | -7.7 |
CoV-19 = Covid-19; PA = Pseudomonas aeruginosa
A quantitative structural-activity relationship (QSAR) is a mathematical relationship that links chemical structure to pharmacological activity or another property for a group of compounds. A QSAR equation, as defined by Crum Brown and Fraser [29], is:
μ = g1A1 + g2A2 + g3A3 +… + gnAn Equation 1
Where an represents one constitutional [structural] property, and gn is its coefficient, μ is the pharmacological activity/Biological activity. Mathematically the equation can be represented as
Y =b1X1 + b2X2 + b3X3 … bnXn + C Equation 2
Density function theory (DFT) at the B3LYP/6-31+G (d,p) level was used to obtain the lowest ligand structure energies using Gaussian09 software [30]. For 2D-QSAR, PaDEL-Descriptor’s software v2.20 [31] was used to calculate the descriptors of the chemicals employed in this study. The molecules were divided into training sets and test sets using a random percentage of 30% test set from the QSARINS software v2.2.4 [32] after descriptors selection. A crucial phase in the development of a QSAR model is model validation. The models were evaluated using a variety of methodologies and statistical factors. According to Galbraith and Tropsha [33], the suggested QSAR model is predictive since it meets the following criteria: Rpred2≥0.5, R2≥0.6, (r2-ro2)/r2 ≤0.1, 0.85≤K≥1.15, 0.85≤K^'≥1.15. Roy and Roy [34] provided another set of measures, r2m metrics, to further refine the prediction capabilities of the existing QSAR models. These measurements determine the proximity between observed and predicted activity [35,36].
Homology Modelling
The amino acid sequence (query protein) of the nucleocapsid phosphoprotein (severe acute respiratory syndrome coronavirus 2) NCBI accession ID: QLI52053 and heme oxygenase (Pseudomonas aeruginosa PAO1) NCBI accession ID: NP_249363, respectively, were obtained from the National Centre for Biotechnology Information (www.ncbi.nlm.nih.gov). Nucleocapsid phosphoprotein and heme oxygenase sequence were BLAST searched against the Protein Data Bank to find a relevant protein with a comparable structure to the query protein. The CLUSTALW program [37], which can be found at http://www2.ebi.ac.uk/CLUSTALW, was used to align the sequence of the human sapiens receptor with that of the target sequence. Using the MODELLER program v9.25 [38], a total of 5 models were created. The discrete optimized protein energy [DOPE] score was used to rank and grade the protein model generated by the MODELLER. One of the five models with the lowest DOPE scores was chosen and evaluated using the ERRAT and RAMPAGE servers. The Ramachandran plot, acquired using the PROCHECK server (https://servicesn.mbi.ucla.edu/PROCHECK/), was used to characterize the structural properties of the modeling protein. Using Discovery studio 2020, the best model was chosen for energy minimization to reduce side-chain clashes, add polar hydrogen, and it was then employed in docking and molecular dynamics simulations.
Docking Simulations
To find the binding site of the 25 selected iminoguanidine derivatives into the built homology model protein described above, molecular docking simulation is performed by using AutoDock vina with PyRx packages v0.8 [39] to evaluate the interaction of compounds with the designed protein. The homology model protein-ligand complexes were compared with the standard drugs in terms of binding affinity and bond residues.
Pharmacokinetics properties and Lipophilicity analysis
Predicting ADMET characteristics is a crucial study for avoiding medication failure in clinical trials [3]. Predictions of pharmacokinetics and bioavailability are important tools in the drug development process and should be taken into account when creating a new drug. The SwissADME web application [40]. which is freely available online, was used to examine the pharmacokinetics of selected compounds. Another software used to calculate lipophilicity is the Data warrior package [41].
Molecular Dynamics Simulations (MDS)
phases with the corresponding receptors. The modelled receptor-ligand complexes were simulated using the NAMD 2.13 Win64-multicore version [42], which included the CHARMM 36 force field [43] and the TIP3P water model.
Several co-time approaches were applied, with a 2-fs integration time step. The CHARMM-GUI web service [44] was used to produce ligand topology and parameter files, and psf files of modelled receptor-ligand complexes and neutralize the system with potassium (K+) and chloride (Cl-) ions. The simulation/production [NPT] ran for 1-ns with 5000 steps of minimization [NVT]. The temperature was kept constant at 303.15 K using a Langevin thermostat. The system's perimeter was surrounded by periodic boundary conditions. Visual molecular dynamics (VMD) [45] was employed for the visualization of the complex.
Results and Discussion
To determine the key structural features of iminoguanidine derivatives against SARS-CoV-2 virus and P. aeruginosa, a combination of QSAR analysis, docking simulation, pharmacokinetics, and molecular dynamics simulations were used in the current study. QSAR was created utilizing a genetic algorithm implemented in the QSARINS software [32]. as a descriptor screening strategy, followed by MLR analysis from a huge pool of descriptors [46]. The statistical parameters to evaluate the quality of these QSAR models are summarized in Table S2, and the best QSAR models among several generated models are shown below (Model 1). The genetic approximation (GA) techniques yield two descriptors with substantial relationships to inhibitory activity pMIC50. In the GA-MLR model of the training set, the following descriptors were chosen: AATS8p = Average Broto-Moreau autocorrelation - lag 8 / weighted by polarizabilities and TPSA = Sum of solvent accessible surface areas of atoms with the absolute value of partial charges greater than or equal 0.2. The model GA-MLR statistical characteristics revealed approximately 91 percent correlation between the experimental and estimated values of the training data set. The strong R2 = 0.91 regression coefficient, low standard deviation (RMSE = 0.13), and value of the Fischer test (F = 75.7) all indicate that the developed model is statistically significant.
Table S2. Model validation parameters and their threshold values
| Validation criteria | Model scores | Threshold | Remarks |
|---|---|---|---|
| Fittings criteria | |||
| R2 | 0.9099 | R2 ≥ 0.6 | Pass |
| R2adj | 0.8978 | R2adj ≥ 0.5 | Pass |
| R2-R2adj | 0.0120 | R2-R2adj ˂ 0.1 | Pass |
| LOF | 0.0269 | Low | Pass |
| Kxx | 0.3217 | Low | Pass |
| Delta K | 0.3036 | Low | Pass |
| RMSE | 0.1276 | RMSEtr ˂ RMSEcv | Pass |
| MAEtr | 0.1019 | close to zero | Pass |
| RSStr | 0.2932 | Pass | |
| CCCtr | 0.9528 | CCC tr ≥ 0.8 | Pass |
| s | 0.1398 | Low | Pass |
| F | 75.6983 | Large | Pass |
| Internal validation criteria | |||
| Q2loo | 0.8413 | Q2LOO ≥ 0.5 | Pass |
| R2-Q2loo | 0.0685 | R2 – Q2LOO ≤ 0.1 | Pass |
| RMSEcv | 0.1693 | Close to zero | Pass |
| MAEcv | 0.1323 | Close to zero | Pass |
| PRESScv | 0.5161 | Pass | |
| CCCcv | 0.9235 | CCC cv ≥ 0.8 | Pass |
| Q2LMO | 0.8055 | Q2LMO ≥ 0.6 | Pass |
| R2Yscr | 0.1156 | R2Yscr ˂ R2 tr | Pass |
| Q2Yscr | -0.3777 | Q2Yscr ˂ Q2LOO | Pass |
| RMSE AV Yscr | 0.3988 | Pass | |
| R2Yrnd | 0.1174 | R2Yscr ˂ R2tr | Pass |
| Q2Yrnd | -0.3688 | Q2Yscr ˂ Q2LOO | Pass |
| External validation criteria | |||
| RMSEext | 0.3241 | Close to zero | Pass |
| MAEext | 0.2528 | Close to zero | Pass |
| PRESSext | 0.6301 | Pass | |
| R2ext | 0.3768 | R2ext ≥ 0.6 | Pass |
| Q2-F1 | 0.1153 | Pass | |
| Q2-F2 | -0.2748 | Pass | |
| Q2-F3 | 0.4188 | Pass | |
| r2m aver. | 0.2307 | Pass | |
| r2m delta | 0.0813 | Pass | |
|
Predictions by LOO:
Exp(x) vs. Pred(y): R2 = 0.8546; R'2o = 0.8525; k': 1.0040; Clos'= 0.0024; r'2m = 0.8156 Pred(x) vs. Exp(y): R2 = 0.8546; R2o = 0.8440; k = 0.9887; Clos = 0.0123; r2m = 0.7669 |
|||
|
External predictions by model equation:
Exp(x) vs. Pred(y): R2 = 0.3768; R'2o = 0.2984; k' = 1.0697; Clos' = 0.2081; r'2m = 0.2713 Pred(x) vs. Exp(y): R2 = 0.3768; R2o = 0.1311; k = 0.9199; Clos = 0.6522; r2m = 0.1900 |
|||
pMIC50 = 2.9147 - 1.4756 [AATS8p] + 0.0074 [TPSA] ----------- -------- Model 1
This model's internal prediction power is shown in Fig. 1 with less Friedman’s lack of fit (LOF) score of 0.0269 and MAEtr value of 0.1019. We used the cross-validation method (CV) with the leave-one-out (LOO) procedure to test the performance of the genetic approximation (GA) and the validity of our choice of descriptors selected by multiple linear regression (MLR). One compound is removed from the data set in this procedure, and the network is trained with the remaining compounds to predict the discarded compound. The procedure is repeated for each compound in the data set in turn [21]. The results of the internal validations (Table S2) show that the cross-validation (Leave one out) approach produced a good correlation, indicating that the QSAR model is unaffected by chance correlation. This provides a preliminary indication of the proposed QSAR model's stability and robustness. The Y-randomization method was used to validate the QSAR model, and the obtained value of the randomized model's correlation coefficient is less than that of the non-randomized model (Fig. S1), and their difference cRr2 is greater than 0.5, indicating that the given QSAR model is considered robust and not the result of random accident. The plot of experimental versus calculated activity values using the GA-MLR model is shown in Fig. 2, which were used for evaluating their generalization capacities.
According to the GFA-MLR equation for external validation criteria, the test set's predicted pMIC50 values are as follows: The RMSEext between the experimental and predicted pMIC50 values was 0.3241 with a low mean absolute error (MAEext) of 0.2528, indicating high predictability. Other parameters such as PRESSext, R2ext, Q2-F1, Q2-F2, Q2-F3, CCCext, r2m aver., and r2m delta met the threshold criteria prove that the model is robust and statistically significant (Table S2).
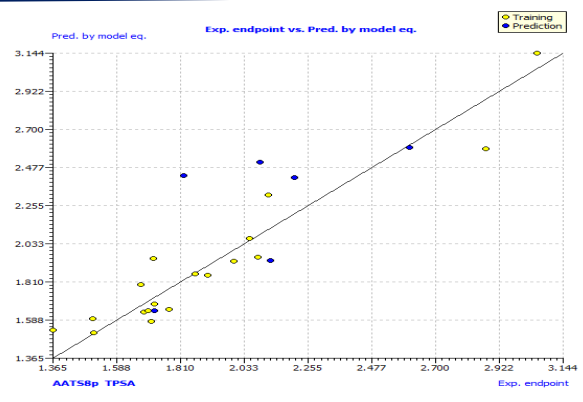
Fig. 1: Sort plot of experimental pMIC50 versus predicted pMIC50 values of model 1.
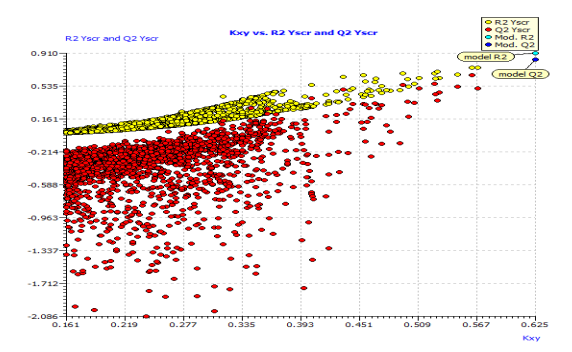
Fig. S1: Scatter plot of the Y-randomization based on QSAR model.
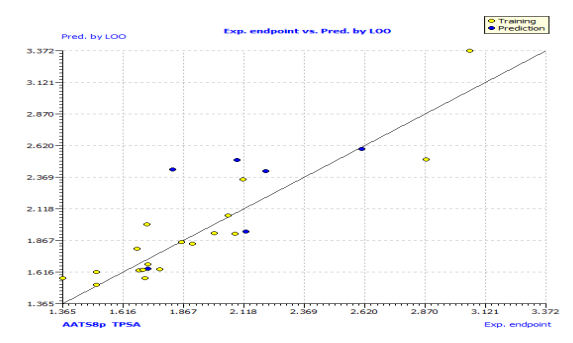
Fig. 2: The plot of GA-MLR predicted activity by LOO versus experimental endpoint activity.
In Fig. S2 and S3, the anti-P. aeruginosa residuals of internal and external predictions are displayed against the predicted endpoint. The estimated correlation coefficients between experimental and predicted pMIC50 values (Predictions by LOO) with intercept (R'2o) and without intercept (R2o) were 0.8525 and 0.8440, while external predictions by the model equation R'2o with intercept and R2o without intercept are 0.2984 and 0.1311, respectively. Also, the values of k and k′ for the internal and external validation shown in Table S2 are within the specified ranges of 0.85 and 1.15 [47]. The values of r2m = 0.7669 and r'2m = 0.8156 were found to be in the acceptable range [34], thereby indicating the good external predictability of the QSAR model. The application domain (AD) of a QSAR model must be determined before it can be used to screen chemicals [48]. A basic measure of a chemical's distance from the model's applicability domain is its leverage (Table S3). The warning value (h* = 0.5) is higher than the leverage (H) values of all the compounds in the training and test sets except compound 19 (Fig. 3). The training set is extremely representative, and none of the chemicals has a significant influence on the model space. Because of its different anti-P. aeruginosa activity mechanism, compound number 3, and 23 standardized residuals were slightly bigger than 2.5 standard deviation units (2.5 δ). Compound 19 (Fig. 3) which is not within the cut-off of the threshold value (0.5) could be due to incorrect experimental input data or its anti-P. aeruginosa activity mechanism.
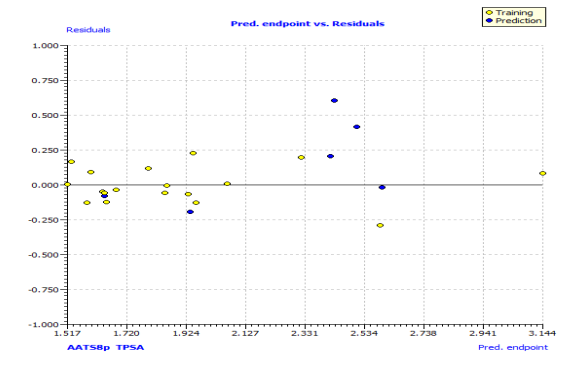
Fig. S2: The plot of residuals versus experimental values of the training set and test set.
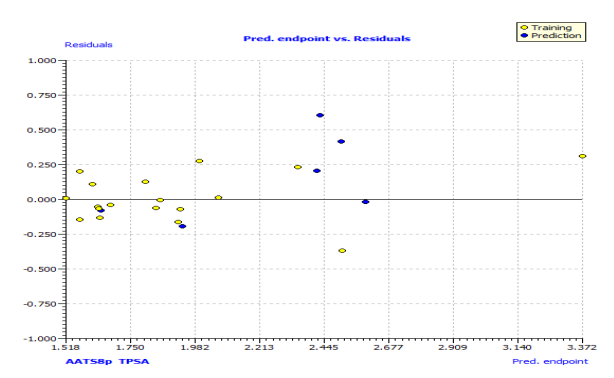
Fig. S3: The plot of residuals versus predicted endpoint of the training set and test set.

Fig. 3: Hat diagonal values versus standardized residuals (William’s plot).
Table S3. Experimental dataset employed for QSAR study along with predicted and actual pMIC50 values against pseudomonas aeruginosa.
| ID | Cpd No. | Status | Observed activity | Pred. by model eq. | HAT i/i (h*=0.5000) |
|---|---|---|---|---|---|
| 1 | 2 | Training | 2.0828 | 1.9580 | 0.2232 |
| 2 | 3 | Prediction | 2.0899 | 2.5087 | 0.1811 |
| 3 | 4 | Training | 1.9978 | 1.9328 | 0.0595 |
| 4 | 5 | Training | 1.8621 | 1.8585 | 0.1558 |
| 5 | 6 | Training | 2.1179 | 2.3176 | 0.1512 |
| 6 | 7 | Training | 1.6848 | 1.6380 | 0.0835 |
| 7 | 8 | Training | 1.7193 | 1.6843 | 0.0790 |
| 8 | 9 | Training | 1.6749 | 1.7950 | 0.0634 |
| 9 | 10 | Training | 1.7185 | 1.9480 | 0.1803 |
| 10 | 11 | Training | 2.0531 | 2.0657 | 0.1808 |
| 11 | 12 | Training | 1.5065 | 1.5996 | 0.1544 |
| 12 | 13 | Prediction | 2.2095 | 2.4197 | 0.1616 |
| 13 | 14 | Prediction | 1.7202 | 1.6438 | 0.0794 |
| 14 | 15 | Training | 1.3655 | 1.5327 | 0.1834 |
| 15 | 16 | Training | 1.6998 | 1.6462 | 0.1494 |
| 16 | 17 | Training | 1.9058 | 1.8505 | 0.0940 |
| 17 | 18 | Training | 1.7716 | 1.6514 | 0.0785 |
| 18 | 19 | Training | 3.0569 | 3.1444 | 0.7223 |
| 19 | 20 | Prediction | 2.6107 | 2.5951 | 0.2160 |
| 20 | 21 | Training | 2.8751 | 2.5885 | 0.2146 |
| 21 | 22 | Prediction | 2.1271 | 1.9383 | 0.0856 |
| 22 | 23 | Prediction | 1.8235 | 2.4308 | 0.1659 |
| 23 | 24 | Training | 1.7101 | 1.5837 | 0.1005 |
| 24 | 25 | Training | 1.5092 | 1.5169 | 0.1261 |
Homology modelling and Docking interactions
The comparative modelling of the severe acute respiratory syndrome and Pseudomonas aeruginosa PAO1 was built using crystal structures of nucleocapsid phosphoprotein (Accession ID: QLI52052) and heme oxygenase (Accession ID: NP_249363) which were retrieved from the NCBI. The above-mentioned virus and bacterial host components could be used as ideal molecular targets for developing novel and effective drug candidates against SAR-CoV-2 and gram-negative bacteria due to their fundamental role in viral and bacterial transmission, replication, and pathogenesis. Then the BLAST program was used to search for a suitable template in Brookhaven Protein Data Bank (PDB) format. The PDB entries: 1ssk_A, 6m3m_A, 6wji_A, 6wzq_A, and 6yun_A as a template for severe acute respiratory syndrome and PDB entries: 1j77_A and 1sk7_A were selected as a template for Pseudomonas aeruginosa. They were found to show good percentage identity, query cover, and low E-value score, and then refined via loop modelling. MODELLER 9.25 was used to examine the structural and sequence similarities between the various templates to choose the best acceptable template for our query sequence among the PDB structures. We finally pick 6wji over the rest because of its percentage identity of 100%, 28% query cover, and E-value score of 3×10-82. The homology modelling for heme oxygenase yielded a similarity identity of 100%, which was confirmed by a percentage identity matrix of PDB code: 1j77. The MODELLER 9.25 and Chimera v1.10.2
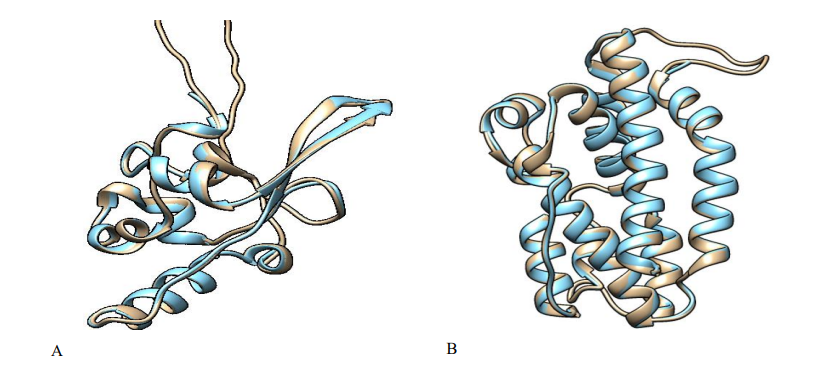
Fig. 4: 3D model structures superimposed (A) nucleocapsid phosphoprotein: (severe acute respiratory syndrome) (B) heme oxygenase (Pseudomonas aeruginosa PAO1).
were used together for model building and alignment and the best model (with the lowest normalized DOPE score) was chosen. As demonstrated in Fig. 4, the target and template proteins sequences of SARS-CoV-2 and Pseudomonas aeruginosa were aligned, respectively.
With all the obtainable data and results, the aligned sequence of the modelled SARS-CoV-2 receptor and Pseudomonas aeruginosa receptor generated by using align2d script in MODELLER 9.25 with their corresponding template are presented in Fig. 5A and Fig. 5B, respectively. Five (5) models were built based on the alignment (Table 1 and Table 2).
The predicted model with the least DOPE score was chosen for molecular docking simulation.
From Table 1 and 2, the fourth (4th) and third (3rd) predicted models were selected for further analysis. The DOPE score profile of the selected modelled SARS-CoV-2 and Pseudomonas aeruginosa protein in Table 1 and Table 2 are presented in Fig. S6 and Fig. S7, respectively.
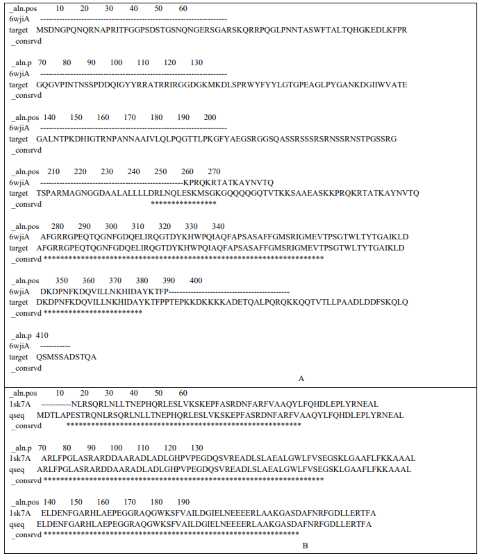
Fig. 5: Sequence alignment result between (A) SARS-CoV-2 receptor with template 6wji.pdb, (B) Pseudomonas aeruginosa receptor with template 1j77.
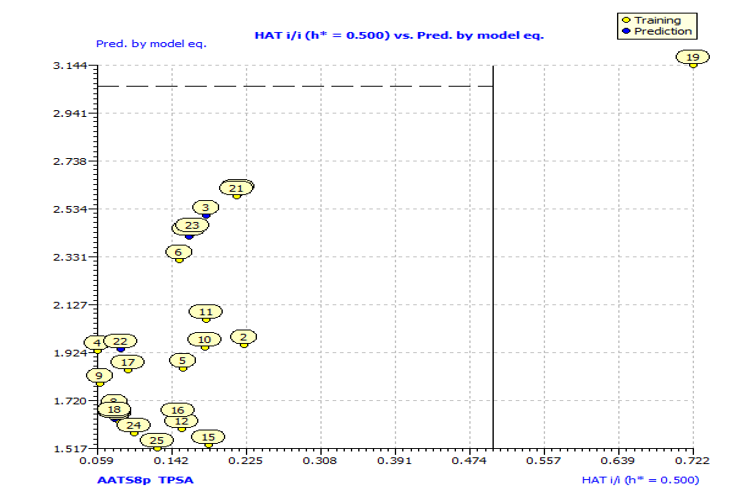
Fig. S4: Insubria graph for the applicability domain check of the descriptor model for the prediction of anti-P. aeruginosa.
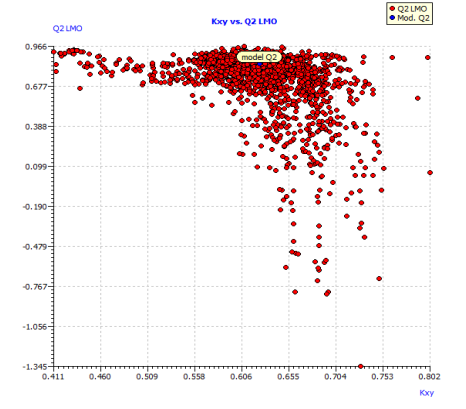
Fig. S5: Plot of LMO validations and Y-scrambled models compared with the original model.
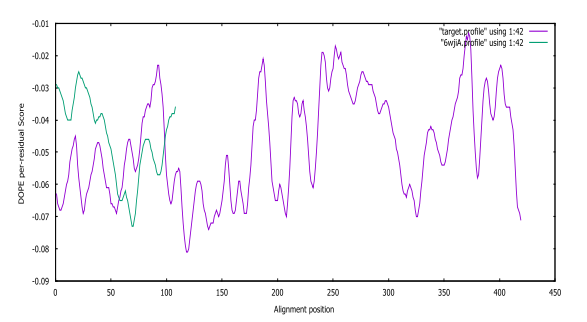
Fig. S6: SARS-CoV-2 DOPE score profiles for the model and templates
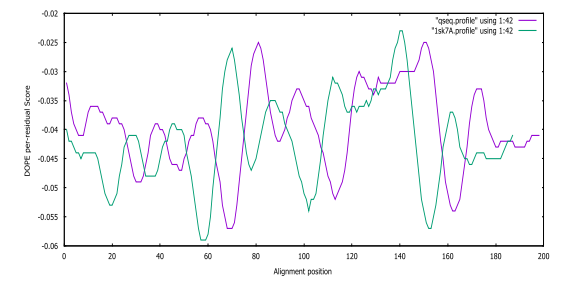
Fig. S7: Pseudomonas aeruginosa DOPE score profiles for the model and templates
The resulting Ramachandran plot (for nucleocapsid phosphoprotein model) suggests that 93.9% of residues angles are in the more favourable regions, 5.5% residues in the additional allowed regions, 0.3% residues in generously allowed regions, and 0.3% residues in disallowed regions, as verified by PROCHECK [Fig. 6]. It means that the final nucleocapsid phosphoprotein 3D model obtained is satisfactory once more. Only one residue is found in the forbidden region according to the Ramachandran plot. Because the residues in the unfavourable regions are far from the substrate-binding domain, they are unlikely to have an impact on ligand-protein binding simulations.
Table 1: Five SARS-CoV-2 models' modeller objective function (molpdf), discrete optimized protein energy (DOPE) score, and genetic algorithm 341 (GA341) score.
| Filename | molpdf | DOPE score | GA341 score |
|---|---|---|---|
| target.B99990001.pdb | 1769.21606 | -15788.35547 | 1.00000 |
| target.B99990002.pdb | 2066.10718 | -16054.67480 | 1.00000 |
| target.B99990003.pdb | 1873.94128 | -16079.09082 | 1.00000 |
| target.B99990004.pdb | 1802.19812 | -16286.84668 | 1.00000 |
| target.B99990005.pdb | 1915.55005 | -15795.42773 | 1.00000 |
Table 2: Five Pseudomonas aeruginosa models' modeller objective function (molpdf), discrete optimized protein energy (DOPE) score, and genetic algorithm 341 (GA341) score.
| Filename | molpdf | DOPE score | GA341 score |
|---|---|---|---|
| qseq.B99990001.pdb | 814.45660 | -21988.66797 | 1.00000 |
| qseq.B99990002.pdb | 759.40881 | -22353.58008 | 1.00000 |
| qseq.B99990003.pdb | 802.71722 | -22495.24805 | 1.00000 |
| qseq.B99990004.pdb | 710.66162 | -22135.44141 | 1.00000 |
| qseq.B99990005.pdb | 698.06323 | -22239.36523 | 1.00000 |
The heme oxygenase model in Fig. 7 suggests that 94.9% residues in most favored regions, 5.1% residues in additional allowed regions, no residues in generously allowed and disallowed regions. The PROCHECK result revealed that the predicted model has a higher quality protein fold, implying that it can be used for subsequent docking experiments [49].
The finding of ligand-binding sites is frequently the first step in determining protein function and therapeutic development [50]. Blind docking was performed to bind ligands and the model structures. PyRx (Autodock vina) predicted the active site of the nucleocapsid phosphoprotein and heme oxygenase receptor with greater average precision in our investigation. All of the compounds were found to have a substantial inhibitory effect by entirely occupying the target protein's active areas (Fig. 8 and 9).
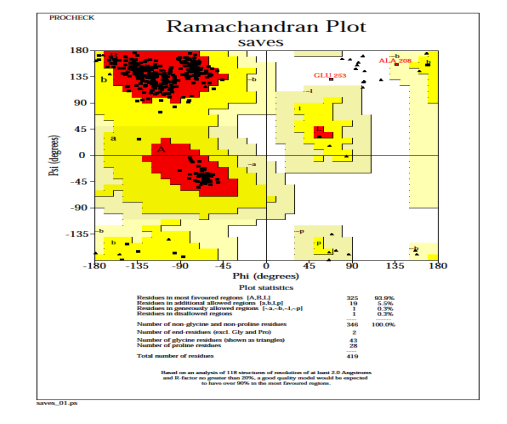
Fig. 6: PROCHECK generated a Ramachandran plot of the distribution of nucleocapsid phosphoprotein.
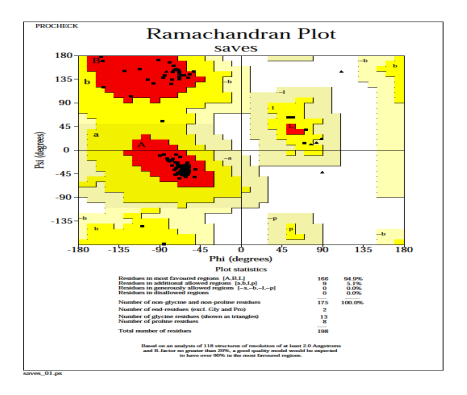
Fig. 7: PROCHECK generated a Ramachandran plot of the distribution of heme oxygenase.
As shown in Table S1, binding affinity values for target protein range between (-4.7 and -7.9 kcal/mol) for both SARS-CoV-2 and P. aeruginosa inhibitors. However, when compared to the standards, compound 18 has the highest binding affinity of -7.7 and -7.9 kcal/mol over Chloroquine (- 4.7 kcal/mol) for SARS-CoV-2 inhibitor, and over Zithromax (-7.7 kcal/mol) for P. aeruginosa inhibitor, respectively. As a result, only the molecule (compound 18) with the strongest binding affinity was visualized with the standards and examined in the Molecular Operating Environment (MOE, 2015), as shown in Fig. 8 and 9, respectively.
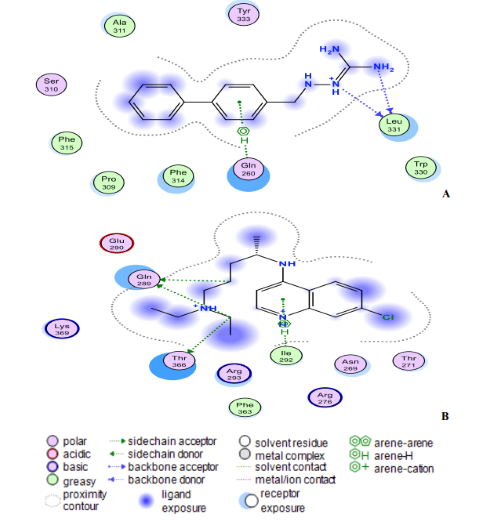
Fig. 8: (A) Compound 18 and (B) Chloroquine interact at the binding sites of the modelling protein in 2D docking poses. Compound 18 has a binding affinity of -7.4 kcal/mol. Chloroquine (binding affinity -4.7 kcal/mol).
The ligand (compound 18) created two hydrogen bonds with one residue in the nucleocapsid phosphoprotein target: Leu331 with a distance of 3.11 Å (-1.4 kcal/mol) and 3.25 Å (-0.7 kcal/mol) indicating a robust and stable contact between this ligand and the major nucleocapsid phosphoprotein active site (Fig. 8A). However, as shown in Fig. 8A, one amino acid, Gln260 is involved in 6-ring interactions with the same compound. Docking studies for the control drug [Chloroquine (Fig. 8B)] demonstrate four hydrogen bond interactions. At a distance of 3.57 Å and internal energy of -0.7 kcal/mol, a hydrogen bond was discovered between the oxygen group Gln289 and the C18 of the ligand. At a distance of 3.56 and 3.47 Å, another hydrogen bond was found between Gln289 (-1 kcal/mol) and Thr173 (-0.9 kcal/mol), respectively. Between Ile292 and the 6-ring, a last pi-hydrogen bond was discovered with a distance of 3.90 Å and internal energy of -1 kcal/mol. Fig. 9A and 9B shows docking interactions with two different compounds (18 and Azithromycin). Docking studies for the high active compound 18 is stabilized by hydrophobic contacts with the residues Lys34, Pro38, Phe39, Val33, and Leu129 as shown in Fig.8A, compound 18 exhibited one hydrogen bond interaction, which was detected at a distance of 3.23 Å and internal energy of -1.2 kcal/mol between the N-group Glu52 amino acid. While (Azithromycin (Fig. 8B)) shows hydrogen bond donor with Ala79, Glu149, and Ser77 residues, with a distance of 7.03, 3.71, 3.53 Å and internal energy of -0.8, -1.2, -0.6 kcal/mol, respectively
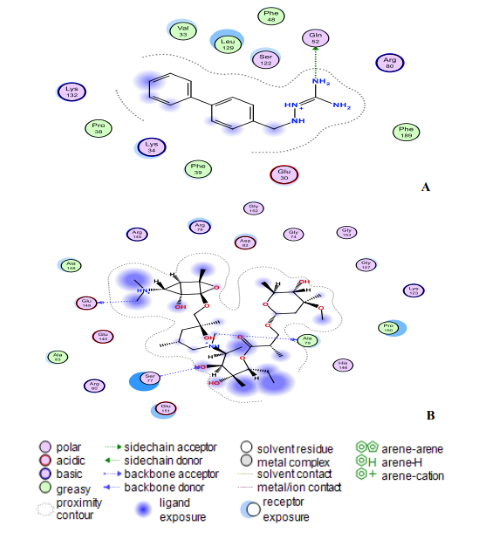
Fig. 9: (A) Compound 18 and (B) Zithromax interact at the binding sites of the modelling protein in 2D docking poses. Compound 18 has a binding affinity of -7.9 kcal/mol. Zithromax (binding affinity -7.7 kcal/mol).
Pharmacokinetic Assessment
To assess the action of an active chemical in the human body after administration, it is necessary to understand its absorption, metabolism, excretion, and distribution (ADME), commonly known as the drug's pharmacokinetic features [51]. Drug-likeness and ADMET analysis were performed on all of the drug-like compounds and standards in our study (Table S4), with some of them adhering to Lipinski's five-criteria rule and Veber's two-criteria rule: molecular weight (acceptable range: 500), number of hydrogen bond donors (acceptable range: 5), number of hydrogen bond acceptors (acceptable range: 10) and lipophilicity (expressed as LogP, acceptable range: 5), TPSA (acceptable range: 140). Compound 18 and chloroquine both pass the Lipinski ROF and Veber ROT, except Azithromycin with a high molecular weight of 748.98, hydrogen bond acceptor of 14, and total polar surface area of 180.08 (Table S4). The fractional extent of a medicine dosage that reaches the therapeutic site of action is known as drug oral bioavailability, and it is represented quantitatively as %F [52]. A probability score of 55% is acceptable, suggesting that it passed the rule of five. Azithromycin scores 17%, but compound 18 and chloroquine both score 55%, indicating good bioavailability (Table S4). The synthetic accessibility score ranges from 1 (very easy) to 10 (extremely difficult). The results in Table S4 show that compound 18 has a simpler synthesis method than the standard drugs. A good result for the chemicals in the drug-likeness with a positive value attribute indicates that the molecule contains fragments that are commonly seen in commercial medications. Except for compounds 5, 14, 16, 17, and 24, all of the compounds exhibited a positive drug-likeness value (Table S5). The drug score combines the contributions of the partition coefficient, solubility, molecular weight, drug-likeness, and toxicity risk into a single meaningful practical value [53]. It could be used to assess the medication candidate's potential. The chemical has a better possibility of becoming a drug candidate when the drug score is higher. The drug score of compound 18 is higher than the two-reference drug (Table S5). This indicates that compound 18 has medium risk values and could be employed as a therapeutic molecule. For its mutagenic, tumorigenic, reproductive effects, and irritating features, the toxicity risk levels estimated using the Data warrior software are shown as none, low, and high (Table S6). The none result represents that the chemical is drug-compatible, while the low and high values indicate the toxicity degree. Chloroquine shows high for its mutagenic and irritant, while compound 18 and Azithromycin show none to all the toxicity effects. The facial skin, which defends the body from chemical and physical threats, also keeps the essential medicine dose from reaching a target organ [52]. Because all of the chemicals found in Table S6 have log Kp negative values, the results reveal that they are all poorly permeable to the skin. Gastrointestinal (GI) absorption data are utilized to quantify the absorption and distribution of these medications. Except for Azithromycin, which has low absorption, all of the compounds are projected to be efficiently absorbed (Table S6). For medications that target the central nervous system, blood-brain (BBB) partitioning and brain distribution are key features [54]. The compounds examined are projected to be non-brain penetrant, therefore adverse effects may be reduced at this level, except for Chloroquine that has yes in BBB permeant (Table S7). Cytochromes P450 are essential for metabolizing foreign substances such as medicines [55]. The ability of drug-like compounds to be eliminated from the body is determined by the identification of metabolic sites. Table S7 lists some of the most likely metabolic sites for Cytochromes P450. Compound 18, which is the compound of interest was found not to inhibit any of the CYP isoenzymes, which means that this compound may have a lower risk of hepatic toxicity. The Chloroquine drug inhibits three of the CYP isoenzymes as shown in Table S7.
Table S4: Lipinski’s and Veber’s rule for ADME analysis of our inhibitors and control drugs.
| Compounds | Lipinski rule of five | Veber’s filter | %F / Synthetic Alerts | |||||
|---|---|---|---|---|---|---|---|---|
| Ligand | MW | HBA | HBD | MLOGP | TPSA | Rotatable bonds | Bioavailability Score | Synthetic Accessibility |
| 2 | 205.26 | 2 | 2 | 1.13 | 80 | 3 | 0.55 | 1.96 |
| 3 | 178.19 | 3 | 3 | 0.5 | 96.99 | 2 | 0.55 | 2.04 |
| 4 | 192.22 | 3 | 2 | 0.82 | 85.99 | 3 | 0.55 | 2.16 |
| 5 | 208.2 | 4 | 3 | 0.1 | 126.42 | 3 | 0.55 | 2.19 |
| 6 | 180.18 | 3 | 2 | 1.49 | 76.76 | 2 | 0.55 | 2.14 |
| 7 | 212.25 | 2 | 2 | 2.06 | 76.76 | 2 | 0.55 | 2.14 |
| 8 | 196.64 | 2 | 2 | 1.65 | 76.76 | 2 | 0.55 | 2.03 |
| 9 | 196.64 | 2 | 2 | 1.65 | 76.76 | 2 | 0.55 | 2.19 |
| 10 | 204.27 | 2 | 2 | 1.98 | 76.76 | 3 | 0.55 | 2.07 |
| 11 | 192.22 | 3 | 2 | 0.82 | 85.99 | 3 | 0.55 | 1.89 |
| 12 | 212.25 | 2 | 2 | 2.06 | 76.76 | 2 | 0.55 | 2.14 |
| 13 | 180.18 | 3 | 2 | 1.49 | 76.76 | 2 | 0.55 | 1.97 |
| 14 | 241.09 | 2 | 2 | 1.8 | 76.76 | 2 | 0.55 | 2.06 |
| 15 | 268.31 | 3 | 2 | 2.25 | 85.99 | 5 | 0.55 | 2.49 |
| 16 | 241.09 | 2 | 2 | 1.8 | 76.76 | 2 | 0.55 | 2.28 |
| 17 | 257.09 | 3 | 3 | 1.24 | 96.99 | 2 | 0.55 | 2.31 |
| 18 | 238.29 | 2 | 2 | 2.55 | 76.76 | 3 | 0.55 | 2.4 |
| 19 | 194.19 | 4 | 4 | -0.04 | 117.22 | 2 | 0.55 | 1.96 |
| 20 | 178.19 | 3 | 3 | 0.5 | 96.99 | 2 | 0.55 | 1.83 |
| 21 | 178.19 | 3 | 3 | 0.5 | 96.99 | 2 | 0.55 | 1.84 |
| 22 | 192.22 | 3 | 2 | 0.82 | 85.99 | 3 | 0.55 | 1.93 |
| 23 | 180.18 | 3 | 2 | 1.49 | 76.76 | 2 | 0.55 | 1.98 |
| 24 | 241.09 | 2 | 2 | 1.8 | 76.76 | 2 | 0.55 | 2.27 |
| 25 | 231.08 | 2 | 2 | 2.22 | 76.76 | 2 | 0.55 | 2.14 |
| Chloroquine | 319.87 | 2 | 1 | 3.2 | 28.16 | 8 | 0.55 | 2.76 |
| Azithromycin (Zithromax) | 748.98 | 14 | 5 | -0.44 | 180.08 | 7 | 0.17 | 8.91 |
Table S5. Lipophilicity, drug score, pains alerts, and efficiency parameters of the 25 iminoguanidine derivatives and the control drugs.
| Cpd No. | Druglikeness | LE | LLE | LELP | Drug Score | PAINS alerts |
|---|---|---|---|---|---|---|
| 2 | 2.7623 | 0.7956 | 6.9293 | 2.2244 | 0.46 | 0 |
| 3 | 1.411 | 0.89941 | 6.9953 | 1.6984 | 0.83 | 1 |
| 4 | 1.3443 | 0.82293 | 6.5946 | 2.1913 | 0.83 | 0 |
| 5 | -3.8616 | 0.7592 | 7.3493 | 1.2536 | 0.16 | 0 |
| 6 | 0.25086 | 0.86765 | 6.2477 | 2.2752 | 0.69 | 0 |
| 7 | 1.5909 | 0.69922 | 5.0872 | 4.3873 | 0.48 | 0 |
| 8 | 1.5916 | 0.85446 | 5.6176 | 2.9016 | 0.77 | 0 |
| 9 | 1.5916 | 0.84906 | 5.5665 | 2.92 | 0.80 | 0 |
| 10 | 0.9808 | 0.73167 | 4.9397 | 4.1826 | 0.50 | 0 |
| 11 | 1.3443 | 0.77988 | 6.1553 | 2.3123 | 0.83 | 0 |
| 12 | 1.5909 | 0.67915 | 4.8531 | 4.517 | 0.30 | 0 |
| 13 | 0.25086 | 0.83221 | 5.912 | 2.3721 | 0.76 | 0 |
| 14 | -0.19914 | 0.82881 | 5.2554 | 3.1352 | 0.57 | 0 |
| 15 | 0.94978 | 0.53667 | 4.6025 | 6.0025 | 0.38 | 0 |
| 16 | -0.19914 | 0.82269 | 5.1974 | 3.1585 | 0.46 | 0 |
| 17 | -0.37901 | 0.76135 | 5.5168 | 2.959 | 0.30 | 1 |
| 18 | 1.5909 | 0.59027 | 4.2122 | 5.9846 | 0.59 | 0 |
| 19 | 1.411 | 0.75662 | 6.5393 | 1.5621 | 0.62 | 0 |
| 20 | 1.411 | 0.81247 | 6.1714 | 1.8802 | 0.86 | 1 |
| 21 | 1.411 | 0.81023 | 6.1502 | 1.8854 | 0.85 | 0 |
| 22 | 1.3443 | 0.75038 | 5.8543 | 2.4032 | 0.79 | 0 |
| 23 | 0.25086 | 0.80606 | 5.6642 | 2.4491 | 0.55 | 0 |
| 24 | -0.19914 | 0.80411 | 5.0213 | 3.2315 | 0.48 | 0 |
| 25 | 1.5916 | 0.74494 | 4.5168 | 4.1417 | 0.70 | 0 |
| Chloroquine | 6.6327 | 0.34706 | 1.5565 | 11.552 | 0.25 | 0 |
| Azithromycin (Zithromax) | 13.854 | 0.08837 | 1.6928 | 18.749 | 0.48 | 0 |
Table S6. Toxicity prediction of the 25 iminoguanidine derivatives and the control drugs
| Copd No. | Mutagenic | Tumorigenic | Reproductive Effective | Irritant | log Kp (cm/s) |
|---|---|---|---|---|---|
| 1 | none | none | none | none | ------ |
| 2 | none | high | none | none | -7.13 |
| 3 | none | none | none | none | -6.66 |
| 4 | none | none | none | none | -6.9 |
| 5 | none | none | none | none | -7.68 |
| 6 | none | none | none | none | -6.99 |
| 7 | none | none | none | none | -6.37 |
| 8 | none | none | none | none | -6.54 |
| 9 | none | none | none | none | -6.71 |
| 10 | none | none | none | none | -6.4 |
| 11 | none | none | none | none | -7.15 |
| 12 | none | high | low | none | -6.37 |
| 13 | none | none | none | none | -6.99 |
| 14 | none | none | none | none | -6.94 |
| 15 | none | none | none | none | -6.56 |
| 16 | none | none | none | none | -6.94 |
| 17 | high | none | none | none | -7.29 |
| 18 | none | none | none | none | -6.26 |
| 19 | none | none | none | none | -7.65 |
| 20 | none | none | none | none | -7.3 |
| 21 | none | none | none | none | -7.11 |
| 22 | none | none | none | none | -6.9 |
| 23 | none | none | none | none | -6.99 |
| 24 | none | none | none | none | -6.94 |
| 25 | none | none | none | none | -6.33 |
| STD1 | high | none | none | high | -4.96 |
| STD2 | none | none | none | none | -8.01 |
STD1: Chloroquine; STD2: Azithromycin (Zithromax)
Table S7. Pharmacokinetics properties of the 25 iminoguanidine derivatives and the control drugs
| Cpd No. | GI absorption | BBB permeant | Pgp substrate | CYP1A2 inhibitor | CYP2C19 inhibitor | CYP2C9 inhibitor | CYP2D6 inhibitor | CYP3A4 inhibitor | |
|---|---|---|---|---|---|---|---|---|---|
| 2 | High | No | No | No | No | No | No | No | |
| 3 | High | No | No | No | No | No | No | No | |
| 4 | High | No | No | No | No | No | No | No | |
| 5 | High | No | Yes | No | No | No | No | No | |
| 6 | High | No | No | No | No | No | No | No | |
| 7 | High | No | No | No | No | No | No | No | |
| 8 | High | No | No | No | No | No | No | No | |
| 9 | High | No | No | No | No | No | No | No | |
| 10 | High | No | No | No | No | No | No | No | |
| 11 | High | No | No | No | No | No | No | No | |
| 12 | High | No | No | No | No | No | No | No | |
| 13 | High | No | No | No | No | No | No | No | |
| 14 | High | No | No | Yes | No | No | No | No | |
| 15 | High | No | No | No | No | No | No | No | |
| 16 | High | No | No | Yes | No | No | No | No | |
| 17 | High | No | No | No | No | No | No | No | |
| 18 | High | No | No | No | No | No | No | No | |
| 19 | High | No | No | No | No | No | No | No | |
| 20 | High | No | No | No | No | No | No | No | |
| 21 | High | No | No | No | No | No | No | No | |
| 22 | High | No | No | No | No | No | No | No | |
| 23 | High | No | No | No | No | No | No | No | |
| 24 | High | No | No | No | No | No | No | No | |
| 25 | High | No | No | Yes | No | No | No | No | |
| STD1 | High | Yes | No | Yes | No | No | Yes | Yes | |
| STD2 | Low | No | Yes | No | No | No | No | No |
STD1: Chloroquine; STD2: Azithromycin (Zithromax)
Molecular dynamics simulation analysis of Compound 18
An MD simulation for binding stability of the model P. aeruginosa inhibitors protein with compound 18, was performed and the results were analysed. The structural stability of the complex was analysed using root-mean-square deviation (RMSD), root means square fluctuation (RMSF), and solvent accessible surface area (SASA) of the model. As shown in Fig. 10 and 11A, the complex reaches the equilibrium state after 1 ns. This finding implies that our complex is stable during and after the simulation. In Fig. 10A, little fluctuations are observed around 10 – 480 ps, but after this time, the RMSD becomes stable until the end of the simulation. The overall average RMSD value after 1ns MD simulations is 3.65 Å. The ligand RMSDs fluctuated with a maximum value of 3.06 Å at about 480 ps followed by more stable interactions for the rest of the simulation. The analysis of the RMSF of the complex is recorded in Fig. 10B. The RMSF is a metric for determining how much an atom or a residue moves over time [56,57]. A close look at the RMSF plots (Fig. 10B) reveals adequate dynamic stability as well as the compactness of the ligand-receptor complexes. From the figure, it has been found that the stability of the ligand-receptor is almost right to the height range of the MD simulation study, and it has provided information as a drug. The involvement of each fragment of a molecule, in terms of hydrophobicity, can be assessed by increasing the corresponding atomic parameter by the degree of contact to the surrounding solvent [57,58]. The contact degree is naturally represented by the solvent-accessible surface area (SASA). The solvent-accessible surface area (SASA) calculation on the amino acid residues within the 1.4 sphere of compound 18 was done to highlight the solvent accessibility toward the simulated complex pocket. Surface racer v5 [59]. was used to compute the complex's SASA. The SASA for complex (Fig. 11A) has a total accessible surface area of 1868.35 Å2, polar accessible area of 5783.65 Å2, and non-polar accessible surface area of 5030.13 Å2 as presented in Table 3. It can be seen from the plot that the SASA values for the compound 18 complex of ∼14 - 14.6 Å2 were rather higher.
Table 3: The solvent-accessible surface area (SASA) for the simulated complex
| The surface area of P. aeruginosa inhibitors protein with compound 18 | |
| Number of non-HOH | non-H atoms=1643 Probe radius=1.40 |
| TOTAL ASA=10813.78 | TOTAL MSA=0.00 |
| Polar ASA=5783.65 | Non-polar ASA=5030.13 |
| Polar MSA=0. 00 | Non-polar MSA=0.00 |
| Total backbone ASA=1868.35 | Total backbone MSA=0.00 |
| Polar backbone ASA=1200.18 | Non-polar backbone ASA=668.17 |
| Polar backbone MSA=0.00 | Non-polar backbone MSA=0.00 |
| Polar side chain ASA=4583.47 | Non-polar side chain ASA=4361.96 |
| Polar side chain MSA=0.00 | Non-polar side chain MSA=0.00 |
| +charge ASA=1087.07 | -charge ASA=1752.79 |
| +charge MSA=0.00 | -charge MSA=0.00 |
| Structure contains 10 cavities | |
ASA = accessible surface area; MSA = molecular surface area
The ligand (compound 18) interacted strongly with the protein, maintaining the majority of the interactions along with the simulation (Fig. 11B). The ligand remained almost in the same place: it started interacting with the residues Phe39, Leu129, Leu129, Lys34, Glu30, HSD26, Leu29, Ser122, Val33, Leu124, and Gly121 of the receptor. At the end of the simulation, the interactions with Lys132, Pro38, Phe189, Arg80, and Glu52 were lost, but new interactions with HSD26, Leu29, Leu124, and Gly121 appeared, with the ligand drifting slightly from the subsurface to a position buried outside the protein. However, there were almost no structural changes on the protein (Fig. 10B).
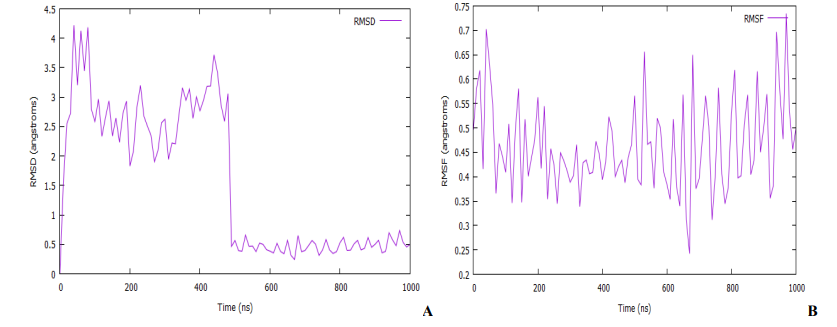
Fig. 10: (A) Root mean square deviation (RMSD) of the C-alpha backbone of the protein complex with compound 18. (B) Root mean square fluctuation (RMSF) for C-alpha backbone atom of the protein complex with compound 18.
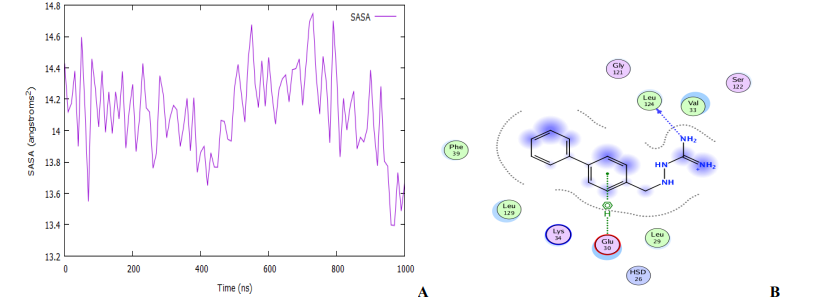
Fig. 11: (A) The plot of solvent accessible surface area (B) Representation of modeled receptor molecule with inhibitor at the active site showing protein-ligand hydrogen bond interaction with residue as Leu124 with arene-H 9nteraction with Glu30.
Conclusion:
Computer-aided drug design (CADD) is a burgeoning field of study. In both academia and industry, computational methods are indispensable and creditable tools that unquestionably speed up the discovery of lead-hit drug. The computational and theoretical interactions of 25 iminoguanidine derivatives with the nucleocapsid phosphoprotein and heme oxygenase structures were studied in this study. Genetic function approximation-multiple linear regression (GFA-MLR) was used to construct a quantitative structure-activity relationship model of iminoguanidine derivatives against Pseudomonas aeruginosa. The GFA-MLR had a significantly predictive capability with greater power. The results show that the model proposed in this research can select autocorrelation and charged partial surface area descriptors (AATS8p and TPSA), which are adequately rich in topological information to encrypt structural landscapes, could be used with other signifiers in the development of predictive QSAR models. The QSAR model was able to show stability and predictive power, confirmed by fittings criteria, internal validation criteria, and external validation criteria. After a successful homology modeling with the query sequences and templates, we came through the key amino acids and the number of hydrogen bonds required to select compounds with inhibitory potential for this Pseudomonas aeruginosa and SARS-CoV-2, based on azithromycin and chloroquine drugs as reference. molecular docking studies results on the modelled receptors indicated that the interaction results of compound 18 showed more type and a better interaction compared to the reference drugs. To investigate their activities following the standard, compound 18 and the reference drugs were subjected to in silico assessments of absorption, distribution, metabolism, and excretion. In comparison to the research series and reference drugs, these novel lead compounds 18 have better pharmacological characteristics. RMSD, RMSF, and SASA analyses were used in a molecular dynamics simulation investigation to demonstrate their binding stability with the individual proteins throughout the simulation timeline. These findings were crucial in the development of novel SARS-CoV-2 and P. aeruginosa with high potential efficacy. The findings of this study can be exploited to produce effective inhibitors for SARS-CoV-2 and P. aeruginosa. These ligands (compound 18), we believe, have the potential to be developed as drugs.
List of Abbreviations
QSAR: Quantitative structure-activity relationship; GFA: Genetic function approximation; MLR: Multiple linear regression; Protein data bank; MDS: Molecular dynamics simulation; ADMET: Absorption, Distribution, Mechanism, Excretion, and Toxicity; PDB: Protein Data Bank; ROF: Rule of five; ROT: Rule of two; RMSD: Root mean square deviation; RMSF: Root mean square fluctuation; %F: Oral bioavailability; SASA: Solvent accessible surface area; BBB: blood-brain barrier; GI: Gastrointestinal
References:
- Saville RU, Bhowmick S, Osman SM, Alasmary FA, Almutairi TM, et al. (2021) Pharmacoinformatics approach-based identification of potential Nsp15 endoribonuclease modulators for SARS-CoV-2 inhibition. Archives of Biochemistry and Biophysics. 700: 108771. [PubMed.]
- Smith R. (2019) Did we eradicate SARS? Lessons learned and the way forward. American Journal of Biomedical Science and Research. 6(2): 152-155. [Ref.]
- Chtita S, Belhassan A, Bakhouch M, Taourati AI, Aouidate A, et al. (2021) QSAR study of unsymmetrical aromatic disulfides as potent avian SARS-CoV main protease inhibitors using quantum chemical descriptors and statistical methods. Chemometrics and Intelligent Laboratory Systems 210: 104266. [PubMed.]
- Tanday S. (2016) Resisting the use of antibiotics for viral infections. The Lancet Respiratory Medicine 4(3): 179. [Ref.]
- Zygiel EM, Obisesan AO, Nelson CE, Oglesby AG, Nolan EM. et al. (2021) Heme protects Pseudomonas aeruginosa and Staphylococcus aureus from calprotectin-induced iron starvation. Journal of Biological Chemistry. 296:100160. [PubMed.]
- Wilson N, Kvalsvig A, Barnard LT, Baker MG. (2020) Case-fatality risk estimates for COVID-19 calculated by using a lag time for fatality. Emerging infectious diseases. 26(6): 1339-1441. [PubMed.]
- Johnson EE, WesslingRM. (2012) Iron metabolism and the innate immune response to infection. Microbes and infection. 14(3): 207-216. [PubMed.]
- Heroven AK, Böhme K, Dersch P. (2012) The Csr/Rsm system of Yersinia and related pathogens: a post-transcriptional strategy for managing virulence. RNA biology. 9(4): 379-391. [PubMed.]
- Kang D, Revtovich AV, Deyanov AE, Kirienko NV. (2021) Pyoverdine inhibitors and gallium nitrate synergistically affect Pseudomonas aeruginosa. mSphere. 6: e00401-421. [Ref.]
- Lansbury L, Lim B, Baskaran V, Lim WS. (2020) Co-infections in people with COVID-19: a systematic review and meta-analysis. Journal of Infection. 81(2): 266-275N. [PubMed.]
- Langford BJ, So M, Raybardhan S, Leung V, Westwood D. et al. (2020) Bacterial co-infection and secondary infection in patients with COVID-19: a living rapid review and meta-analysis. Clinical Microbiology and Infection. 26(12): 1622-1629. [PubMed.]
- Bengtsson PJ, Kristiansson E, Larsson DJ. (2018) Environmental factors influencing the development and spread of antibiotic resistance. FEMS microbiology reviews, 42(1): 053. [Ref.]
- Adedeji AO, Severson W, Jonsson C, Singh K, Weiss SR, et al. (2013) Novel Inhibitors of Severe Acute Respiratory Syndrome Coronavirus Entry That Act by Three Distinct Mechanism. Journal of Virology. 87(14): 8017-8028. [PubMed.]
- Hastie KM, Liu T, Li S, King LB, Ngo N, et al. (2011) Crystal structure of the Lassa virus nucleoprotein-RNA complex reveals a gating mechanism for RNA binding. Proc Natl Acad Sci U S A. 108(48): 19365-19370. [PubMed.]
- Baig MH, Ahmad K, Roy S, Ashraf JM, Adil M. (2016) Computer aided drug design: success and limitations. Current pharmaceutical design. 22(5):572-581. [PubMed.]
- Zaki AA, Ashour A, Elhady SS, Darwish KM, Al-Karmalawy AA. (2022) Calendulaglycoside A showing potential activity against SARS-CoV-2 main protease: Molecular docking, molecular dynamics, and SAR studies. Journal of traditional and complementary medicine. 12(1):16-34. [PubMed.]
- Cozza G. (2017) The development of CK2 inhibitors: From traditional pharmacology to in silico rational drug design. Pharmaceuticals. 10(1):26. [PubMed.]
- Huang HJ, Hsin WY, Chien-Yu C, Chih-Ho H, Hsin-Yi C, et al. (2010) "Current developments of computer-aided drug design." Journal of the Taiwan Institute of Chemical Engineers. 41(6): 623-635. [PubMed.]
- Macalino SJY, Gosu V, Hong S, Choi S. (2015) Role of computer-aided drug design in modern drug discovery. Archives of pharmacal research. 38(9): 1686-1701. [PubMed.]
- Valasani KR, Hu G, Chaney MO, Yan SS. (2013) Structure‐based design and synthesis of benzothiazole phosphonate analogues with inhibitors of human ABAD‐Aβ for treatment of Alzheimer’s disease. Chemical biology & drug design, 81(2): 238-249. [PubMed.]
- Edache EI, Uzairu A, Mamza PA, Shallangwa GA. (2021) Structure-based simulated scanning of Rheumatoid Arthritis inhibitors: 2D-QSAR, 3D-QSAR, Docking, Molecular dynamics simulation, and Lipophilicity indices calculation. Scientific African, SCIAF. 5(6): e01088. [Ref.]
- Heroven AK, Nuss AM, Dersch P. (2017) RNA-based mechanisms of virulence control in Enterobacteriaceae. RNA Biology. 14(5): 471-487. [PubMed.]
- Khare N, Maheshwari SK, Jha AK. (2020) Screening and identification of secondary metabolites in the bark of Bauhinia variegata to treat Alzheimer’s disease by using molecular docking and molecular dynamics simulations. Journal of Biomolecular Structure and Dynamics. 5988-5998. [Ref.]
- Maqsood M, Karim Y, Fatima E, Marriam S, Afzal R. (2020) Computer Aided Drug Designing (CADD): Tools used for Structure based Drug Designing. Biomedical Letters. 6(2): 149-163. [Ref.]
- Edache EI, Uzairu A, Mamza PA, Shallangwa GA. (2020) A comparative QSAR analysis, 3D-QSAR, molecular docking, and molecular design of iminoguanidine-based inhibitors of HemO: A rational approach to antibacterial drug design. Journal of Drugs and Pharmaceutical Science. 4(3): 21-36. [Ref.]
- Arkansas A, Arif AR, Syahputra G, Sukarti S, Kurniawan I. (2021) Theoretical studies of Thiazolyl-Pyrazoline derivatives as promising drugs against malaria by QSAR modelling combined with molecular docking and molecular dynamics. Molecular Simulation. 1-14: 988-1001. [Ref.]
- Ramesh P, Nagendrappa JH, Hulikal SK, Shankara SKHS. (2021) Comparative analysis of Rosetta stone events in Klebsiella pneumoniae and Streptococcus pneumoniae for drug target identification. Beni-Suef University Journal of Basic and Applied Sciences. 10: 37. [Ref.]
- Edache EI, Uzairu A, Mamza PAP, Shallangwa GA. (2020) Prediction of HemO Inhibitors Based on Iminoguanidine using QSAR, 3DQSAR Study, Molecular Docking, Molecular Dynamic Simulation, and ADMET. Journal of Drug Design and Discovery Research J Drug Design Discov Res. 1(2): 36-52. [Ref.]
- Dearden JC. (2017) The history and development of quantitative structure-activity relationships (QSARs). In Oncology: breakthroughs in research and practice. 51. [Ref.]
- Gaussian RA, Scalmani V, Cheeseman G, Barone B, Mennucci, et al. (2009) Gaussian. Inc., Wallingford CT. 121: 150-166. [Ref.]
- Yap CW. (2011) PaDEL-Descriptor version 2.20. A software to calculate molecular descriptors and fingerprints. [Ref.]
- Gramatica P, Chirico N, Papa E, Cassani S, Kovarich S. (2013) QSARINS: A New Software for the Development, Analysis, and Validation of QSAR MLR Models. Journal of Computational Chemistry. 34(24): 2121-2132. [Ref.]
- Tropsha A, Gramatica P, Gombar V. (2003) The importance of being earnest: validation is the absolute essential for successful application and interpretation of QSPR models. QSAR & Combinatorial Science. 22(1): 69-77. [Ref.]
- Roy PP, Roy K. (2008) On Some Aspects of Variable Selection for Partial Least Squares Regression Models. QSAR Comb. Sci. 27(3): 302-313. [Ref.]
- Roy K, Mitra I, Kar S, Ojha PK, Das RN, et al. (2012) Comparative Studies on Some Metrics for External Validation of QSPR Models. J. Chem. Inf. Model. 52(2): 396-408. [Ref.]
- Ojha PK, Mitra I, Das R, Roy K. (2011) Further Exploring rm2 Metrics for Validation of QSPR Models. Chemom. Intell. Lab. Syst. 107: 194-205. [Ref.]
- Thompson JD, Higgins DG, Gibson TJ. (1994) Clustal-W- improving the sensitivity of progressive multiple sequence alignment through sequence weighting, position-specific gap penalties and weight matrix choice. Nucleic Acids Res. 22(22): 4673-4680. [PubMed.]
- Sali A, Potterton L, Yuan F, Vlijmen HV, Karplus M. (1995) Evaluation of comparative protein modeling by MODELLER. Proteins: Structure, Function, and Bioinformatics. 23(3): 318-326. [PubMed.]
- Trott O, Olson AJ. (2010) AutoDock Vina: improving the speed and accuracy of docking with a new scoring function, efficient optimization, and multithreading. J Comput Chem. 31(2): 455-461. [PubMed.]
- Daina A, Michielin O, Zoete V. (2017) SwissADME: a free web tool to evaluate pharmacokinetics, drug-likeness, and medicinal chemistry friendliness of small molecules. Sci. Rep. 7: 42717. [Ref.]
- Gupta M, Lee HJ, Barden CJ, Weaver DF. (2019) The Blood-Brain Barrier (BBB) Score. J. Med. Chem. 62(21): 9824-9836. [Ref.]
- Phillips JC, Braun R, Wang W, Gumbart J, Tajkhorshid E, et al. (2005) Scalable molecular dynamics with NAMD. J. Comput. Chem. 26(16): 1781-1802. [PubMed.]
- MacKerell AD, Bashford D, Bellott MLDR, Dunbrack RL, Evanseck JD, et al. (1998) All-atom empirical potential for molecular modeling and dynamics studies of proteins. The journal of physical chemistry B. 102(18): 3586-3616. [PubMed.]
- Jo S, Kim T, Iyer VG, Im W. (2008) HARMM-GUI: a web-based graphical user interface for CHARMM. J Comput Chem. 29(11): 1859-65. [PubMed.]
- Humphrey W, Dalke A, Schulten K. (1996) “VMD - Visual Molecular Dynamics”, J Molec Graphics. 14(1): 33-38. [PubMed.]
- Gramatica P, Cassani S, Chirico N. (2014) QSARINS-Chem: Insubria Datasets and New QSAR/QSPR Models for Environmental Pollutants in QSARINS. Journal of Computational Chemistry. 35(13): 1036-1044. [PubMed.]
- Golbraikh A, Tropsha A. (2002) Predictive QSAR modeling based on diversity sampling of experimental datasets for the training and test set selection. Journal Computer. Aided Molecular Design. 16(5-6): 357-369. [PubMed.]
- Edache EI, Arthur DE, Abdulfatai U. (2016) Quantitative Structure-Activity Relationship Analysis of the Anti-tyrosine Activity of Some Tetraketone and Benzyl-benzoate Derivatives Based on Genetic Algorithm-Multiple Linear Regression. Journal of Chemistry and Materials Research. 6(1): 3-13. [Ref.]
- Wallner B, Elofsson A. (2005) All are not equal: a benchmark of different homology modeling programs. Protein Sci. 14 (5): 1315-1327. [Ref.]
- Shafiu S, Edache EI, Sani U, Abatyough M. (2017) Docking and Virtual Screening Studies of Tetraketone Derivatives as Tyrosine Kinase (EGFR) Inhibitors: A Rational Approach to Anti-Fungi Drug Design. J. Pharm. Med. Res. 3(1): 78-80. [Ref.]
- Messaoudi O, Sudarman E, Bendahou M, Jansen R, Stadler M, et al. (2019) Kenalactams A-E, Polyene Macrolactams Isolated from Nocardiopsis CG3. J. Nat. Prod. 82(5): 1081-1088. [PubMed.]
- Ouassaf M, Belaidi S, Khamouli S, Belaidi H, Chtita S. (2021) Combined 3D-QSAR and Molecular Docking Analysis of Thienopyrimidine Derivatives as Staphylococcus aureus Inhibitors. Acta Chim. Slov. 68(2): 289-303. [PubMed.]
- Kumar TVA, Kabilan S, Parthasarathy V. (2017) Compounds to Target Cancer using QSAR and Pharmacophore Modelling. International Journal of PharmTech Research. 10(4): 219-224. [Ref.]
- Athar M, Lone MY, Jha PC. (2018) Designing of calixarene based drug carrier for dasatinib, lapatinib and nilotinib using multilevel molecular docking and dynamics simulations. J Incl Phenom Macrocycl Chem. 90(3): 157-169. [Ref.]
- Hadni H, Elhallaoui M. (2020) 2D and 3D-QSAR, molecular docking and ADMET properties in silico studies of azaaurones as antimalarial agents. New J. Chem. 1-13. [Ref.]
- Efremov RG, Chugunov AO, Pyrkov TV, Priestle JP, Arseniev AS, et al. (2007) Molecular lipophilicity in protein modeling and drug design. Current medicinal chemistry. 14(4): 393-415. [PubMed.]
- Mathpal S, Joshi T, Sharma P, Joshi T, Pundir H, et al. (2020) A dynamic simulation study of FDA drug from zinc database against COVID-19 main protease receptor. Journal of Biomolecular Structure and Dynamics. 1-17. [Ref.]
- Martínez L. (2015) Automatic identification of mobile and rigid substructures in molecular dynamics simulations and fractional structural fluctuation analysis. PloS one. 10(3): e0119264. [PubMed.]
- Tsodikov OV, Record MT, Sergeev YV. (2002) A novel computer program for fast exact calculation of accessible and molecular surface areas and average surface curvature. J. Comput. Chem. 23(6): 600-609. [PubMed.]