>Corresponding Author : Thomas M Johnson
>Article Type : Case Report
>Volume : 4 | Issue : 2
>Received Date : 20 Feb, 2024
>Accepted Date : 05 March, 2024
>Published Date : 09 March, 2024
>DOI : https://doi.org/10.54289/JDOE2400106
>Citation : Duval RJ, Washington MA, Kua S, Stancoven BW, Lincicum AR, et al. (2024) The Influence of Neodymium-Doped Yttrium Aluminum Garnet Laser Pulse Repetition Rate on Cytokine Secretion from Peripheral Blood Mononuclear Cells in Vitro. J Dent Oral Epidemiol 4(2): doi https://doi.org/10.54289/JDOE2400106
>Copyright : © 2024 Duval RJ, et al. This is an open-access article distributed under the terms of the Creative Commons Attribution License, which permits unrestricted use, distribution, and reproduction in any medium, provided the original author and source are credited.
Original Research Article | Open Access
1Department of Periodontics, Army Postgraduate Dental School, Postgraduate Dental College, Uniformed Services University, Fort Eisenhower, GA, USA
2Department of Clinical Investigation, Dwight David Eisenhower Army Medical Center, Fort Eisenhower, GA, USA
*Corresponding author: Thomas M Johnson, Department of Periodontics, Army Postgraduate Dental School, Postgraduate Dental College, Uniformed Services University, Fort Eisenhower, GA, USA
Abstract
Objective: Biological effects of infrared laser energy at various exposure parameters have been characterized in previous in vitro and animal studies. However, the impact of pulse repetition rate (PRR) has not been evaluated in this context. The purpose of this investigation was to assess the influence of PRR on cytokine secretion from peripheral blood mononuclear cells (PBMCs) subjected to pulsed neodymium-doped yttrium aluminum garnet (Nd:YAG) laser energy.
Materials and Methods: Rat PBMCs were cultured in vitro then stimulated using a lipopolysaccharide concentration of 0 or 100 ng/ml. Cultures received Nd:YAG laser radiation (1064 nm, 5 W, 30 s) at PRR of 0 (untreated controls), 20, 30, 40, or 60 Hz. Concentrations of tumor necrosis factor-α (TNF-α), macrophage inflammatory protein (MIP)-1α, macrophage inflammatory protein (MIP)-2, monocyte chemoattractant protein-1 (MCP-1), interferon-gamma-induced protein (IP)-10, interleukin (IL)-6, and IL-10 were recorded using a magnetic microsphere immunoassay. The main effects of PRR and LPS stimulation on cytokine concentrations, and the interaction between PRR and LPS stimulation, were assessed using two-way analysis of variance. Bonferroni post hoc tests were used to identify pairwise differences between groups.
Results: The main effect of PRR was statistically significant for MIP-1α (P = 0.018), TNF-α (P = 0.025), MCP-1 (P < 0.001), MIP-2 (P = 0.013), and IL-6 (P = 0.031). Five of six pro-inflammatory cytokines exhibited significantly lower mean concentrations in laser-exposed compared with control cultures at one or more PRR. However, no statistically significant differences were found between PRR groups.
Conclusions: Under the described conditions, statistically significant differences in cytokine secretion were observed between laser-exposed and control cultures, consistent with prior reports. However, PRR appears to be an irrelevant factor in immunomodulation of PBMCs.
Keywords: Lasers; Inflammation; Monocytes; Cytokines; Low-Level Light Therapy; Lipopolysaccharides
Abbreviations: HMT: Host Modulation Therapy, PBM: Photobiomodulation, PRR: Pulse Repetition Rate, PBMCs: Peripheral Blood Mononuclear Cells, RPMI: Roswell Park Memorial Institute, FBS: Fetal Bovine Serum, LPS: Lipopolysaccharide, LPT: Laser Periodontal Therapy, SRP: Scaling and Root Planning
Introduction
Periodontitis—which represents the most prevalent noncommunicable chronic inflammatory condition affecting humans—is a multifactorial disease resulting in severe periodontal tissue destruction and tooth loss in more than one billion individuals worldwide [1,2].
Putative periodontal pathogens within dental plaque represent the etiology of periodontitis [3-5]. However, most of the tissue destruction is not directly attributable to microorganisms or their products. Rather, loss of alveolar bone and clinical attachment derives primarily from the host inflammatory response [6]. Complex dental biofilms result in the emergence of a panoply of host-derived cytokines that mediate resorption of alveolar bone and loss of attachment [6-9].
Standard therapy for periodontitis includes professional mechanical plaque removal and establishment of an effective oral hygiene regimen that routinely disrupts biofilm development [1]. This approach has served as the mainstay of periodontal therapy for more than a century [10]. However, periodontists have also attempted to modify the inflammation and tissue destruction induced by etiological microorganisms—an approach termed “host modulation therapy” (HMT) [11]. HMT strategies include use of bone-sparing, antiproteinase, and anti-inflammatory agents [11,12]. These pharmacological interventions have had limited clinical applicability due in part to adverse effects of the medications. Electromagnetic radiation may represent a means of therapeutically altering host immunological function without risk of untoward medication-related effects [13].
It has long been recognized that electromagnetic radiation can interact with living tissues and that it is possible for some of these interactions to produce therapeutic effects [14-18]. Laser radiation is unique in that it consists of collimated, monochromatic Gaussian light beams that can be directed toward specific regions on the surfaces of living tissues [19]. Reduction in inflammation has been one of the most reproducible effects of laser photobiomodulation (PBM), a term encompassing photophysical and photochemical phenomena unrelated to thermal tissue responses [13,20-23]. Wavelengths in the red and near infrared spectral regions (600 through 1200 nm) have shown favorable anti-inflammatory effects [13]. Yamaura and colleagues exposed TNF-α-stimulated synoviocytes isolated from rheumatoid arthritis patients to infrared diode laser energy (810 nm), with fluence of 5 or 25 J/cm2 [24]. The authors reported dose-dependent reduction in mRNA and protein levels of TNF-α, IL-1β, and IL-8 [24]. Similarly, Hwang et al. compared IL-8 and IL-6 expression in cytokine-stimulated macrophages subjected to laser energy (405, 532, or 650 nm) at doses up to 1.6 J/cm2 [25]. All wavelengths significantly reduced IL-8 expression compared with controls; only the 405 nm wavelength produced statistically significant reduction in IL-6 expression [25]. In activated dendritic cells derived from the mouse femur, Chen and colleagues found reduced cell-surface markers of inflammation and IL-12 secretion in response to infrared diode laser irradiation (810 nm, 0.3 or 3 J/cm2) [26].
Researchers have also assessed the anti-inflammatory effects of lasers emitting in this segment of the electromagnetic spectrum using animal models. Safavi et al. assessed the influence of He-Ne laser irradiation (632.8 nm, 7.5 J/cm2) on IL-1β, interferon-Υ (IFN- Υ), and TNF-α expression in wounded gingiva of male Wistar rats [27]. The authors noted statistically significant reduction in IL-1β and IFN- Υ expression in the laser-irradiated groups compared with controls [27]. Aimbire and colleagues evaluated the effect of Ga-AsI-Al diode laser irradiation (650 nm, 5.2 J/cm2) on TNF-α concentrations in diaphragm muscle tissue from male Wistar rats [28]. The authors recorded statistically significant reduction in TNF-α concentrations in the laser-irradiated group compared with untreated controls [28]. Although existing evidence from in vitro and animal studies suggest a possible clinical role for laser irradiation in limiting inflammation, the ideal wavelength remains unidentified, and parameters such as fluence, irradiance, pulse duration, pulse repetition rate (PRR), exposure time, and number of exposures have not been optimized. The purpose of this investigation was to assess the influence of PRR on cytokine secretion levels in stimulated and unstimulated rat PBMC cultures subjected to near-infrared radiation from a neodymium-doped yttrium aluminum garnet (Nd:YAG) laser.
Materials and Methods
Cell Culture
Frozen Rat peripheral blood mononuclear cells (PBMCs) (IQ Biosciences, Berkeley, California, USA) were thawed and suspended in Roswell Park Memorial Institute (RPMI) medium, supplemented with 10% fetal bovine serum (FBS) penstrap. To remove cryoprotectant, cells were centrifuged for 7 minutes at 700 g, then transferred to 96-well plates (2 x 10⁴ cells per well). Cells were stimulated with 0 or 100 ng/ml of lipopolysaccharide (LPS), and incubated for 24 hours at 37⸰C.
Irradiation Parameters
An Nd:YAG laser (1064 nm, Lightwalker AT, Fotona, Dallas, Texas, USA) was used to irradiate cultures, and a 320-micron optical fiber directed the laser beam perpendicularly to the plated cells at a distance of 1.8 mm. A standardized support system ensured a reliable and reproducible laser position. For each group, exposure time and power output remained constant at 30 seconds and 5 W, respectively. PRR was set at 0 (untreated controls), 20, 30, 40, or 60 Hz (Figure 1, Table 1). After irradiation, cells were returned to the incubator for one hour at 37˚ C.

Figure 1: Diagram of 96-well plate depicting the experimental design. Exposure time and average power remained constant at 30 s and 5 W, respectively. For each group, laser parameters differed only in the pulse repetition rate—0 (untreated control cultures), 20, 30, 40, or 60 Hz.
Table 1: Nd:YAG laser irradiation parameters by treatment group.
| Group | Average Power (W) | Peak Power (W) | Pulse Energy (mJ) | Pulse Duration (µs) | Repetition Rate (Hz) | Fiber Diameter (µm) | Irradiance at tip (W/cm2) | Fluence at tip* (J/cm2) | Distance to target (mm) | Irradiation time (s) |
|---|---|---|---|---|---|---|---|---|---|---|
| Control | 0 | 0 | 0 | 0 | NA | NA | 0 | 0 | NA | 0 |
| 1 | 5 | 2500 | 250 | 100 | 20 | 320 | 6217 | 311 | 1.8 | 30 |
| 2 | 5 | 1667 | 167 | 100 | 30 | 320 | 6217 | 207 | 1.8 | 30 |
| 3 | 5 | 1250 | 125 | 100 | 40 | 320 | 6217 | 155 | 1.8 | 30 |
| 4 | 5 | 833 | 83 | 100 | 60 | 320 | 6217 | 103 | 1.8 | 30 |
*Per pulse
Evaluation of Cytokine Concentrations
Supernatant was extracted and analyzed using a magnetic microsphere immunoassay (MAGPIX System, Luminex, Austin, Texas, USA) permitting quantification of IL-6, IL-10, MIP-1α, MIP-2, MCP-1, TNF-α, and IP-10. The sensitivities for these assays were 30.7, 2.7, 0.8, 9.0, 9.0, 1.9, and 1.4 pg/ml, respectively (Table 2). The analysis software (MAGPIX System, Luminex) processed assay images and determined cytokine/chemokine concentrations in pg/ml using standard curves.
Table 2: Inflammatory mediators evaluated by magnetic microsphere immunoassay and the associated minimum detectable concentrations (MDCs)
| Analyte | 2-Hour Protocol | ||
|---|---|---|---|
| MDC (pg/mL) | MDC + 2 SD (pg/mL) | 1 | Interleukin-6 (IL-6) | 30.7 | 86.2 |
| 2 | Interleukin-10 (IL-10) | 2.7 | 6.9 |
| 3 | Macrophage inflammatory protein-1α (MIP-1α) | 0.8 | 2.1 |
| 4 | Macrophage inflammatory protein-2 (MIP-2) | 9.0 | 21.8 |
| 5 | Monocyte chemoattractant protein-1 (MCP-1) | 9.0 | 21.8 |
| 6 | Tumor Necrosis Factor-α (TNF-α) | 1.9 | 7.2 | 7 | Interferon gamma-induced protein 10 (IP-10) | 1.4 | 3.5 |
Statistical Analysis
For each evaluated cytokine, a two-way analysis of variance was conducted to compare the main effects of LPS stimulation and PRR, and the interaction between these factors, on cytokine concentration. Bonferroni post hoc tests were used to elucidate statistically significant pairwise differences among PRR levels (0, 20, 30, 40, and 60 Hz). Differences were accepted as significant at an alpha level of 0.05.
Results
Cytokine secretion by rat PBMCs was evaluated using magnetic microsphere immunoassay following exposure to LPS and treatment with directed Nd:YAG laser energy with PRRs ranging from 20 to 60 Hz (20, 30, 40, and 60 HZ) at constant pulse duration (100 μs), average power (5 W), and irradiation time (30 s). Thus, pulse energy ranged from 83 to 250 mJ, peak power ranged from 833 to 2500 W, and fluence ranged from 103 to 311 J/cm2 (Table 1). The degree to which LPS increased cytokine concentrations varied by cytokine, with the largest increases noted for IP-10, TNF-α, and MIP-2 (Figure 2). Notably, mean concentrations of five pro-inflammatory cytokines were significantly lower in laser-exposed versus control LPS-stimulated PBMC cultures (Table 3). These were the macrophage/monocyte-produced signaling molecule TNF-α (F (4, 110) = 2.90, P = 0.025), the chemotactic inflammatory cell recruiting protein MIP-1α (F (4, 110) = 3.13, P = 0.018), a related protein known as MIP-2 (F (4, 110) = 3.35, P = 0.013), the monocyte/macrophage chemoattractant protein MCP-1 (F (4, 110) = 10.51, P < 0.001), and the proinflammatory interleukin IL-6 (F (4, 110) = 2.76, P = 0.031). The model for IL-10 was not statistically significant (F(9, 110) = 1.67, P = 0.105), and the main effect of PRR was not statistically significant for IP-10 (F(4, 110) = 2.01, P = 0.098). The interaction term between LPS stimulation and PRR was significant for the MIP-1α (F(4, 110) = 3.39, P = .012) and TNF-α (F(4, 110) = 2.79, P = .030) models.
A trend for peak effect at PRRs of 20 Hz and 40 Hz was noted (Figure 2). Maximal reduction the in mean concentrations of IP-10 and MIP-2 was observed at PRR of 20 Hz, whereas maximal reduction in the mean concentrations of MIP-1α, MCP-1, IL-6, and IL-10 occurred at 40 Hz. It is important to note that these observations include some concentration differences that did not reach statistical significance.
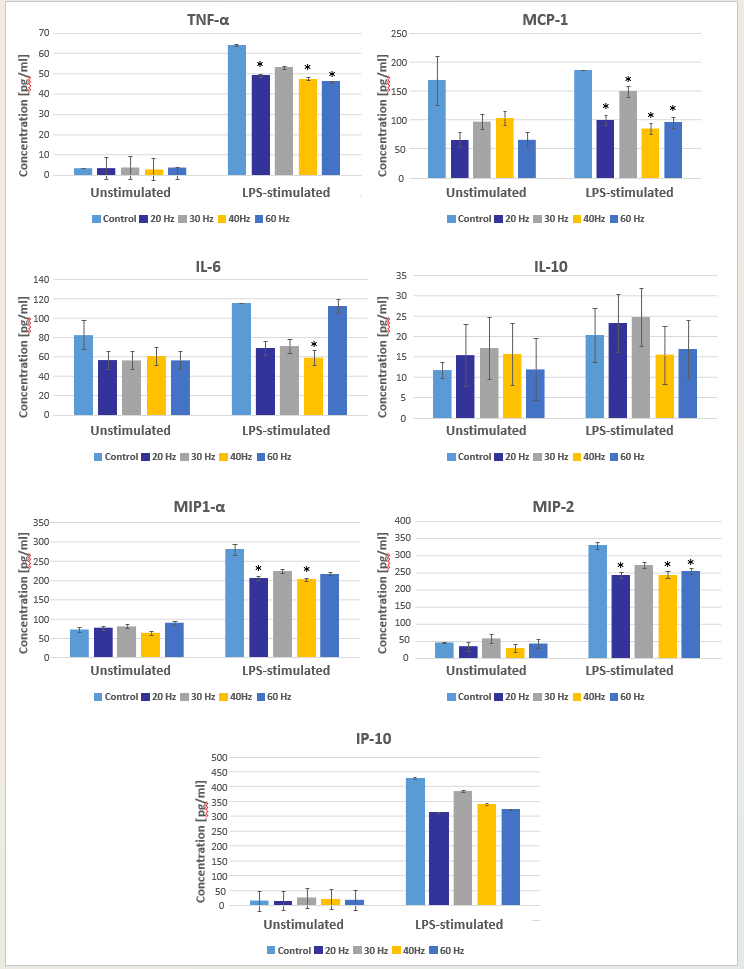
Figure 2: Cytokine secretion in response to pulsed neodymium-doped yttrium aluminum garnet laser irradiation at various pulse repetition rates in lipopolysaccharide-stimulated and unstimulated peripheral blood mononuclear cell cultures. Statistically significant decreases in concentration compared with controls (no laser irradiation) are identified by asterisks.
All cytokines evaluated except IL-10 exhibited a trend for concentration reduction in laser-irradiated cultures compared with controls, with MIP1-α, TNF-α, MCP-1, MIP-2, and IL-6 each exhibiting a statistically significant decrease in concentration at one or more PRRs. Bonferroni post hoc tests identified the specific PRRs that resulted in statistically significant concentration differences compared with controls (Table 4). No statistically significant differences were noted between laser-irradiated cultures. Thus, PRR had no detectable influence on any cytokine concentration in this investigation.
Table 3: Results of two-way factorial ANOVA for each cytokine evaluated
| MIP-1α | |||||
|---|---|---|---|---|---|
| Source | Type III Sum of Squares | df | Mean Square | F | Sig. |
| Corrected Model | 686106.37a | 9 | 76234.04 | 40.93 | <.001 |
| Intercept | 2534268.15 | 1 | 2534268.15 | 1360.71 | <.001 |
| LPS | 623689.25 | 1 | 623689.25 | 334.87 | <.001 |
| PRR | 23326.62 | 4 | 5831.66 | 3.13 | .018 |
| LPS * PRR | 25245.42 | 4 | 6311.36 | 3.39 | .012 |
| Error | 204870.87 | 110 | 1862.46 | ||
| Total | 4306291.87 | 120 | |||
| Corrected Total | 890977.24 | 119 | |||
| a. R Squared = .770 (Adjusted R Squared = .751) | |||||
| TNF-α | |||||
| Source | Type III Sum of Squares | df | Mean Square | F | Sig. |
| Corrected Model | 69762.81a | 9 | 7751.42 | 73.27 | <.001 |
| Intercept | 85882.54 | 1 | 85882.54 | 811.81 | <.001 |
| LPS | 66559.77 | 1 | 66559.77 | 629.16 | <.001 |
| PRR | 1225.05 | 4 | 306.26 | 2.90 | .025 |
| LPS * PRR | 1180.24 4 | 295.06 | 2.79 | .030 | |
| Error | 11637.04 | 110 | 105.79 | ||
| Total | 217768.59 | 120 | |||
| Corrected Total | 81399.85 | 119 | |||
| a. R Squared = .857 (Adjusted R Squared = .845) | |||||
| MCP-1 | |||||
| Source | Type III Sum of Squares | df | Mean Square | F | Sig. |
| Corrected Model | 188278.65a | 9 | 20919.850 | 6.02 | <.001 |
| Intercept | 1385150.30 | 1 | 1385150.297 | 398.78 | <.001 |
| LPS | 15047.14 | 1 | 15047.135 | 4.33 | .040 |
| PRR | 146017.24 | 4 | 36504.311 | 10.51 | <.001 |
| LPS * PRR | 15607.98 | 4 | 3901.995 | 1.12 | .349 |
| Error | 382083.34 | 110 | 3473.485 | ||
| Total | 2125855.83 | 120 | |||
| Corrected Total | 570361.99 | 119 | |||
| a. R Squared = .330 (Adjusted R Squared = .275) | |||||
| MIP-2 | |||||
| Source | Type III Sum of Squares | df | Mean Square | F | Sig. |
| Corrected Model | 1516999.412a | 9 | 168555.490 | 54.953 | <.001 |
| Intercept | 2696576.963 | 1 | 2696576.963 | 879.152 | <.001 |
| LPS | 1434227.702 | 1 | 1434227.702 | 467.594 | <.001 |
| PRR | 41048.325 | 4 | 10262.081 | 3.346 | .013 |
| LPS * PRR | 23176.701 | 4 | 5794.175 | 1.889 | .117 |
| Error | 337397.158 | 110 | 3067.247 | ||
| Total | 5875212.463 | 120 | |||
| Corrected Total | 1854396.570 | 119 | |||
| a. R Squared = .818 (Adjusted R Squared = .803) | |||||
| IP-10 | |||||
| Source | Type III Sum of Squares | df | Mean Square | F | Sig. |
| Corrected Model | 3365757.27a | 9 | 373973.03 | 57.01 | <.001 |
| Intercept | 3998789.17 | 1 | 3998789.17 | 609.62 | <.001 |
| LPS | 3228033.05 | 1 | 3228033.05 | 492.11 | <.001 |
| PRR | 52799.34 | 4 | 13199.84 | 2.01 | .098 |
| LPS * PRR | 50828.43 | 4 | 12707.11 | 1.94 | .109 |
| Error | 721549.12 | 110 | 6559.54 | ||
| Total | 10484044.58 | 120 | |||
| Corrected Total | 4087306.39 | 119 | |||
| a. R Squared = .823 (Adjusted R Squared = .809) | |||||
| IL-6 | |||||
| Source | Type III Sum of Squares | df | Mean Square | F | Sig. |
| Corrected Model | 62224.02a | 9 | 6913.78 | 2.88 | .004 |
| Intercept | 616962.20 | 1 | 616962.20 | 256.66 | <.001 |
| LPS | 14936.23 | 1 | 14936.23 | 6.21 | .014 |
| PRR | 26526.82 | 4 | 6631.71 | 2.759 | .031 |
| LPS * PRR | 11256.24 | 4 | 2814.06 | 1.171 | .328 |
| Error | 264422.37 | 110 | 2403.84 | ||
| Total | 1036932.62 | 120 | |||
| Corrected Total | 326646.39 | 119 | |||
| a. R Squared = .190 (Adjusted R Squared = .124) | |||||
| IL-10 | |||||
| Source | Type III Sum of Squares | df | Mean Square | F | Sig. |
| Corrected Model | 2089.38a | 9 | 232.15 | 1.67 | .105 |
| Intercept | 33253.80 | 1 | 33253.80 | 238.80 | <.001 |
| LPS | 935.60 | 1 | 935.60 | 6.72 | .011 |
| PRR | 682.54 | 4 | 170.64 | 1.23 | .304 |
| LPS * PRR | 285.59 | 4 | 71.40 | .51 | .726 |
| Error | 15317.97 | 110 | 139.25 | ||
| Total | 55915.29 | 120 | |||
| Corrected Total | 17407.35 | 119 | |||
Table 4: Bonferroni post hoc tests
| MIP-1α | 95% Confidence interval | |||||
|---|---|---|---|---|---|---|
| (I) Laser | (J) Laser | Mean Difference (I-J) | Std. Error | Sig. | Lower bound | Upper bound |
| Control | 20 Hz | 44.25* | 12.46 | .006 | 8.56 | 79.94 |
| 40 Hz | 51.35* | 12.46 | <.001 | 15.66 | 87.03 | |
| TNF-α | 95% Confidence interval | |||||
| (I) Laser | (J) Laser | Mean Difference (I-J) | Std. Error | Sig. | Lower bound | Upper bound |
| Control | 20 Hz | 9.46* | 2.97 | .019 | .96 17.97 | |
| 40 Hz | 10.77* | 2.97 | .004 | 2.26 | 19.28 | |
| 60 Hz | 11.14* | 2.97 | .003 | 2.63 | 19.65 | |
| MCP-1 | 95% Confidence interval | |||||
| (I) Laser | (J) Laser | Mean Difference (I-J) | Std. Error | Sig. | Lower bound | Upper bound |
| Control | 20 Hz | 92.10* | 17.01 | <.001 | 43.36 | 140.84 |
| 30 Hz | 49.64* | 17.01 | .043 | .90 | 98.38 | |
| 40 Hz | 87.47* | 17.01 | <.001 | 38.73 | 136.21 | |
| 60 Hz | 94.45* | 17.01 | <.001 | 45.71 | 143.19 | |
| MIP-2 | 95% Confidence interval | |||||
| (I) Laser | (J) Laser | Mean Difference (I-J) | Std. Error | Sig. | Lower bound | Upper bound |
| Control | 20 Hz | 58.96* | 15.99 | .004 | 13.16 | 104.76 |
| 40 Hz | 59.30* | 15.99 | .003 | 13.55 | 105.15 | |
| 60 Hz | 48.07* | 15.99 | .033 | 2.27 | 93.87 | |
| MIP-1α | 95% Confidence interval | |||||
| (I) Laser | (J) Laser | Mean Difference (I-J) | Std. Error | Sig. | Lower bound | Upper bound |
| Control | 40 Hz | 43.76* | 14.15 | .025 | 3.21 | 84.30 |
Discussion
Despite clinical advantages associated with laser periodontal therapy (LPT), the therapeutic use of pulsed Nd:YAG laser energy in the treatment of periodontitis remains a controversial topic within the field of periodontology [29-33]. Currently available evidence supports only modest clinical benefit beyond scaling and root planing (SRP) alone when
Nd:YAG lasers are used adjunctively with SRP [33]. High heterogeneity among studies and lack of controlled clinical research has hampered the ability of clinicians to draw conclusions regarding LPT efficacy and predictability [32,33]. It has been suggested that PBM-induced modulation of inflammation is a unique benefit of LPT among available periodontitis treatments [34]. However, it will be necessary to define specific laser energy parameters (pulse duration, PRR, average power, spot size, fluence, cumulative energy delivered) that produce immune modulation in a predictable and governable manner. Toward that objective, this study evaluated the impact of Nd:YAG laser PRR variation on the secretion of cytokines in unstimulated and LPS-stimulated rat PBMC cultures.
Prior studies have consistently reported statistically significant reductions in various inflammatory markers in response to PBM using devices that emit in the red and infrared portions of the electromagnetic spectrum [13,20-28]. Observations in the present study are consistent with these prior investigations. Only two evaluated cytokines did not exhibit a statistically significant change in concentration in any laser-exposed group—IP-10 and the potent anti-inflammatory cytokine IL-10. No previous investigation using a near infrared laser has directly assessed the influence of PRR on cytokine secretion. Under the described conditions, PRR exerted no statistically significant influence on levels of the evaluated mediators of inflammation.
The high number of technical parameters with potential to influence outcome measures represents a major challenge in conducting and interpreting research into the biological effects of lasers. It has been suggested that fluence (also called energy density) may be the parameter most appropriate for defining the “dose” applied [13]. For multiple outcome measures, biphasic dose responses have been reported. Over a range of PBM exposure levels, a response maximum is reached at some value. When the exposure is increased beyond that threshold, the observed positive response diminishes or vanishes. At even higher fluence values, the investigator may find a negative or inhibitory result [13]. It is likely that the results recorded in the present study were highly dependent upon the specific irradiation parameters applied and the target cell type. Although PRR had no apparent effect on cytokine concentrations in the present study, repetition rate could influence cytokine secretion when lower or higher fluence values are applied.
LPS, which is a constituent of gram-negative bacterial cell walls, was used to stimulate PBMC cell cultures in this in vitro study. The bacterial species that are frequently isolated together at sites exhibiting bone and attachment loss—Porphyrmonas gingivalis, Tannerella forsythia, and Treponema denticola—are facultative gram-negative anaerobes [3-5]. Thus, the LPS used in this study represented an attempt to mimic a stimulant that mononuclear cells encounter at periodontitis-affected sites. However, the model used in this study in no way replicates the complexity of the in vivo microenvironment. At periodontitis sites receiving LPT, laser energy interacts with a diverse set of bacterial species within the biofilm, host cells of the innate and adaptive immune systems, and numerous cell types within the sulcular epithelium, gingival connective tissue, alveolar bone, and periodontal ligament. Thus, the complex cascade of gene expression and intercellular signaling likely induced by LPT will be challenging to fully characterize [35-41].
Conclusions
Under the described conditions, statistically significant differences in cytokine secretion were observed between laser-exposed and control cultures. However, findings of the present study do not support a correlation between PRR and cytokine concentrations. These observations may be highly specific for the target cell type utilized and the radiation parameters applied.
Author contributions: All authors have contributed substantially to conceptualization of this investigation, drafting the article, critical review, and editing. All authors have approved the final version of the manuscript.
Conflicts of interest: The authors report no financial, economic, or professional interests that may have influenced the design, execution, or presentation of this work.
Disclaimers: The views expressed in this manuscript are those of the authors and do not necessarily reflect the official policy of the United States Government, the Department of Defense, the Defense Health Agency, or Uniformed Services University of the Health Sciences.
Funding: The Defense Health Agency funded this research entirely. The authors received no extramural funding.
References
- Sanz M, Herrera D, Kebschull M, Chapple I, Jepsen S, et al. (2020) Treatment of stage I-III periodontitis-The EFP S3 level clinical practice guideline. J Clin Periodontol. 47(Suppl 22): 4-60. [PubMed.]
- Chen MX, Zhong YJ, Dong QQ, Wong HM, Wen YF. (2021) Global, regional, and national burden of severe periodontitis, 1990-2019: An analysis of the Global Burden of Disease Study 2019. J Clin Periodontol. 48(9): 1165-1188. [PubMed.]
- Ezzo PJ, Cutler CW. (2003) Microorganisms as risk indicators for periodontal disease. Periodontol 2000. 32: 24-35. [PubMed.]
- Scannapieco FA, Dongari-Bagtzoglou A. (2021) Dysbiosis revisited: Understanding the role of the oral microbiome in the pathogenesis of gingivitis and periodontitis: A critical assessment. J Periodontol. 92(8): 1071-1078. [PubMed.]
- Kumar PS. (2021) Microbial dysbiosis: The root cause of periodontal disease. J Periodontol. 92(8): 1079-1087. [PubMed.]
- Van Dyke TE. (2008) The management of inflammation in periodontal disease. J Periodontol. 79(8 Suppl): 1601-1608. [Ref.]
- Graves D. (2008) Cytokines that promote periodontal tissue destruction. J Periodontol. 79(8 Suppl): 1585-1591. [PubMed.]
- Gonçalves TO, Costa D, Brodskyn CI, Duarte PM, César Neto JB, et al. (2010) Release of cytokines by stimulated peripheral blood mononuclear cells in chronic periodontitis. Arch Oral Biol. 55(12): 975-980. [PubMed.]
- Page RC. (1991) The role of inflammatory mediators in the pathogenesis of periodontal disease. J Periodontal Res. 26(3): 230-242. [PubMed.]
- Hujoel P, Zina LG, Cunha-Cruz J, Lopez R. (2012) Historical perspectives on theories of periodontal disease etiology. Periodontol 2000. 58(1): 153-160. [PubMed.]
- Reddy MS, Geurs NC, Gunsolley JC. (2003) Periodontal host modulation with antiproteinase, anti-inflammatory, and bone-sparing agents. A systematic review. Ann Periodontol. 8(1): 12-37. [PubMed.]
- Castro Dos Santos NC, Furukawa MV, Oliveira-Cardoso I, Cortelli JR, Feres M, et al. (2022) Does the use of omega-3 fatty acids as an adjunct to non-surgical periodontal therapy provide additional benefits in the treatment of periodontitis? A systematic review and meta-analysis. J Periodontal Res. 57(3): 435-447. [PubMed.]
- Hamblin MR. (2017) Mechanisms and applications of the anti-inflammatory effects of photobiomodulation. AIMS Biophys. 4(3): 337-361. [PubMed.]
- Glass GE. (2021) Photobiomodulation: The clinical applications of low-level light therapy. Aesthet Surg J. 41(6): 723-738. [PubMed.]
- Faria LV, Andrade IN, Dos Anjos LMJ, de Paula MVQ, de Souza da Fonseca A, et al. (2020) Photobiomodulation can prevent apoptosis in cells from mouse periodontal ligament. Lasers Med Sci. 35(8): 1841-1848. [PubMed.]
- Peplow PV, Chung TY, Ryan B, Baxter GD. (2011) Laser photobiomodulation of gene expression and release of growth factors and cytokines from cells in culture: a review of human and animal studies. Photomed Laser Surg. 29(5): 285-304. [PubMed.]
- Tsai SR, Hamblin MR. (2017) Biological effects and medical applications of infrared radiation. J Photochem Photobiol B. 170: 197-207. [Ref.]
- Prindeze NJ, Moffatt LT, Shupp JW. (2012) Mechanisms of action for light therapy: a review of molecular interactions. Exp Biol Med. 237(11): 1241-1248. [PubMed.]
- Luke AM, Mathew S, Altawash MM, Madan BM. (2019) Lasers: A review with their applications in oral medicine. J Lasers Med Sci. 10(4): 324-329. [Ref.]
- Giannelli M, Bani D, Tani A, Pini A, Margheri M, et al. (2009) In vitro evaluation of the effects of low-intensity Nd: YAG laser irradiation on the inflammatory reaction elicited by bacterial lipopolysaccharide adherent to titanium dental implants. J Periodontol. 80(6): 977-84. [PubMed.]
- Giannelli M, Bani D, Tani A, Pini A, Margheri M, et al. (2009) In vitro evaluation of the effects of low-intensity Nd: YAG laser irradiation on the inflammatory reaction elicited by bacterial lipopolysaccharide adherent to titanium dental implants. J Periodontol. 80(6): 977-984. [PubMed.]
- Li K, Liang Z, Zhang J, Zuo X, Sun J, et al. (2020) Attenuation of the inflammatory response and polarization of macrophages by photobiomodulation. Lasers Med Sci. 35(7): 1509-1518. [PubMed.]
- de Brito Sousa K, Rodrigues MFSD, de Souza Santos D, Mesquita-Ferrari RA, Nunes FD, et al. (2020) Differential expression of inflammatory and anti-inflammatory mediators by M1 and M2 macrophages after photobiomodulation with red or infrared lasers. Lasers Med Sci. 35(2): 337-343. [PubMed.]
- Yamaura M, Yao M, Yaroslavsky I, Cohen R, Smotrich M, et al. (2009) Low level light effects on inflammatory cytokine production by rheumatoid arthritis synoviocytes. Lasers Surg Med. 41(4): 282-290. [PubMed.]
- Hwang MH, Shin JH, Kim KS, Yoo CM, Jo GE, et al. (2015) Low level light therapy modulates inflammatory mediators secreted by human annulus fibrosus cells during intervertebral disc degeneration in vitro. Photochem Photobiol. 91(2): 403-410. [PubMed.]
- Chen AC, Huang YY, Sharma SK, Hamblin MR. (2011) Effects of 810-nm laser on murine bone-marrow-derived dendritic cells. Photomed Laser Surg. 29(6): 383-389. [Ref.]
- Safavi SM, Kazemi B, Esmaeili M, Fallah A, Modarresi A, et al. (2008) Effects of low-level He-Ne laser irradiation on the gene expression of IL-1beta, TNF-alpha, IFN-gamma, TGF-beta, bFGF, and PDGF in rat's gingiva. Lasers Med Sci. 23(3): 331-335. [PubMed.]
- Aimbire F, Lopes-Martins RA, Castro-Faria-Neto HC, Albertini R, Chavantes MC, et al. (2006) Low-level laser therapy can reduce lipopolysaccharide-induced contractile force dysfunction and TNF-alpha levels in rat diaphragm muscle. Lasers Med Sci. 21(4): 238-244. [PubMed.]
- Yukna RA, Carr RL, Evans GH. (2007) Histologic evaluation of an Nd: YAG laser-assisted new attachment procedure in humans. Int J Periodontics Restorative Dent. 27(6): 577-587. [PubMed.]
- Yukna RA. (2023) Clinical evaluation of Laser-Assisted New Attachment Procedure (LANAP) surgical treatment of chronic periodontitis: a retrospective case series of 1-year results in 22 consecutive patients. J Periodontal Implant Sci. 53(3): 173-183. [PubMed.]
- Nevins ML, Camelo M, Schupbach P, Kim SW, Kim DM, et al. (2012) Human clinical and histologic evaluation of laser-assisted new attachment procedure. Int J Periodontics Restorative Dent. 32(5): 497-507. [PubMed.]
- Mills MP, Rosen PS, Chambrone L, Greenwell H, Kao RT, et al. (2018) American Academy of Periodontology best evidence consensus statement on the efficacy of laser therapy used alone or as an adjunct to non-surgical and surgical treatment of periodontitis and peri-implant diseases. J Periodontol. 89(7): 737-742. [PubMed.]
- Chambrone L, Ramos UD, Reynolds MA. (2018) Infrared lasers for the treatment of moderate to severe periodontitis: An American Academy of Periodontology best evidence review. J Periodontol. 89(7): 743-765. [PubMed.]
- Aoki A, Mizutani K, Schwarz F, Sculean A, Yukna RA, et al. (2015) Periodontal and peri-implant wound healing following laser therapy. Periodontol 2000. 68(1): 217-269. [PubMed.]
- Abergel RP, Meeker CA, Lam TS, Dwyer RM, Lesavoy MA, et al. (1984) Control of connective tissue metabolism by lasers: recent developments and future prospects. J Am Acad Dermatol. 11(6): 1142-1150. [PubMed.]
- Kim K, Kim IS, Cho TH, Seo YK, Hwang SJ. (2015) High-intensity Nd: YAG laser accelerates bone regeneration in calvarial defect models. J Tissue Eng Regen Med. 9(8): 943-951. [PubMed.]
- Gkogkos AS, Karoussis IK, Prevezanos ID, Marcopoulou KE, Kyriakidou K, et al. (2015) Effect of Nd: YAG low level laser therapy on human gingival fibroblasts. Int J Dent. 2015: 258941. [PubMed.]
- Chellini F, Sassoli C, Nosi D, Deledda C, Tonelli P, et al. (2010) Low pulse energy Nd: YAG laser irradiation exerts a biostimulative effect on different cells of the oral microenvironment: "an in vitro study". Lasers Surg Med. 42(6): 527-539. [PubMed.]
- McCawley TK, McCawley MN, Rams TE. (2018) Immediate effects of laser-assisted new attachment procedure (LANAP) on human periodontitis microbiota. J Int Acad Periodontol. 20: 163-171. [PubMed.]
- Kim IS, Cho TH, Kim K, Weber FE, Hwang SJ. (2010) High power-pulsed Nd: YAG laser as a new stimulus to induce BMP-2 expression in MC3T3-E1 osteoblasts. Lasers Surg Med. 42(6): 510-518. [PubMed.]
- Karoussis IK, Kyriakidou K, Psarros C, Lang NP, Vrotsos IA. (2017) Nd: YAG laser radiation (1.064 nm) accelerates differentiation of osteoblasts to osteocytes on smooth and rough titanium surfaces in vitro. Clin Oral Implants Res. 28(7): 785-790. [PubMed.]